AI Tools for Research: a Sandbox Session Recap
Last week, we hosted our annual Professional Development Day for the Library. It coincided with Fall Break, so things were quieter than usual around campus. We use this day for in-house training and collegial bonding.
I led our AI Sandbox session focused on Research Tools. Every time I chat with a student or faculty member, it seems they mention a new AI tool they’re exploring, and the number has become staggering. Ithaka S+R has developed a Generative AI Product Tracker that is currently over 50 pages long, highlighting key features, costs, pros/cons, and other notes.
I had heard about many of the tools but hadn’t had time to try them out, so I used this event as both an excuse and a deadline to dive in. The spirit of our sandbox sessions is to invite people in with an open and curious mindset. What do these tools do? How are they useful? What are their interfaces like? How are they different?
I initially chose ten tools to experiment with, eventually narrowing that down to six for our professional development session. I selected them based on variety, aiming to showcase different capabilities. I gave a 2–3-minute demo of each one, using the same paper or topic to explore how they handled the content. Afterward, we had hands-on time—a key part of our sandbox philosophy. We can read, listen, watch, and talk about AI all day, but it’s important for people to experience it firsthand. I encouraged participants to try one or two tools, and then we discussed what was interesting, what was problematic, what was clunky, what raised questions, and, of course, what was helpful.
We’re at an interesting juncture with these tools. As the Ithaka list shows, there’s a lot of experimentation happening. The focus isn’t just on access to content, but on the relationships between connections. How are authors, papers, and topics linked? Can we find new connections, emerging pathways, or gaps in the research?
It’s still early days, and many of these tools are likely startups hoping to be acquired. But from a historical perspective, it’s fascinating to see how different products take essentially the same content (research article abstracts) and use them in new ways. I think this wave of innovation will push our database and publisher vendors to reimagine interfaces, interactions, and integrations across knowledge sources and ecosystems.
With that in mind, I thought I’d share a quick overview of the platforms I introduced at our session. While the interfaces will undoubtedly evolve, it’s useful and intriguing to examine the current landscape of AI-powered tools, what they can do, and what they look like.
A Tour of Tools
First up was LitMaps
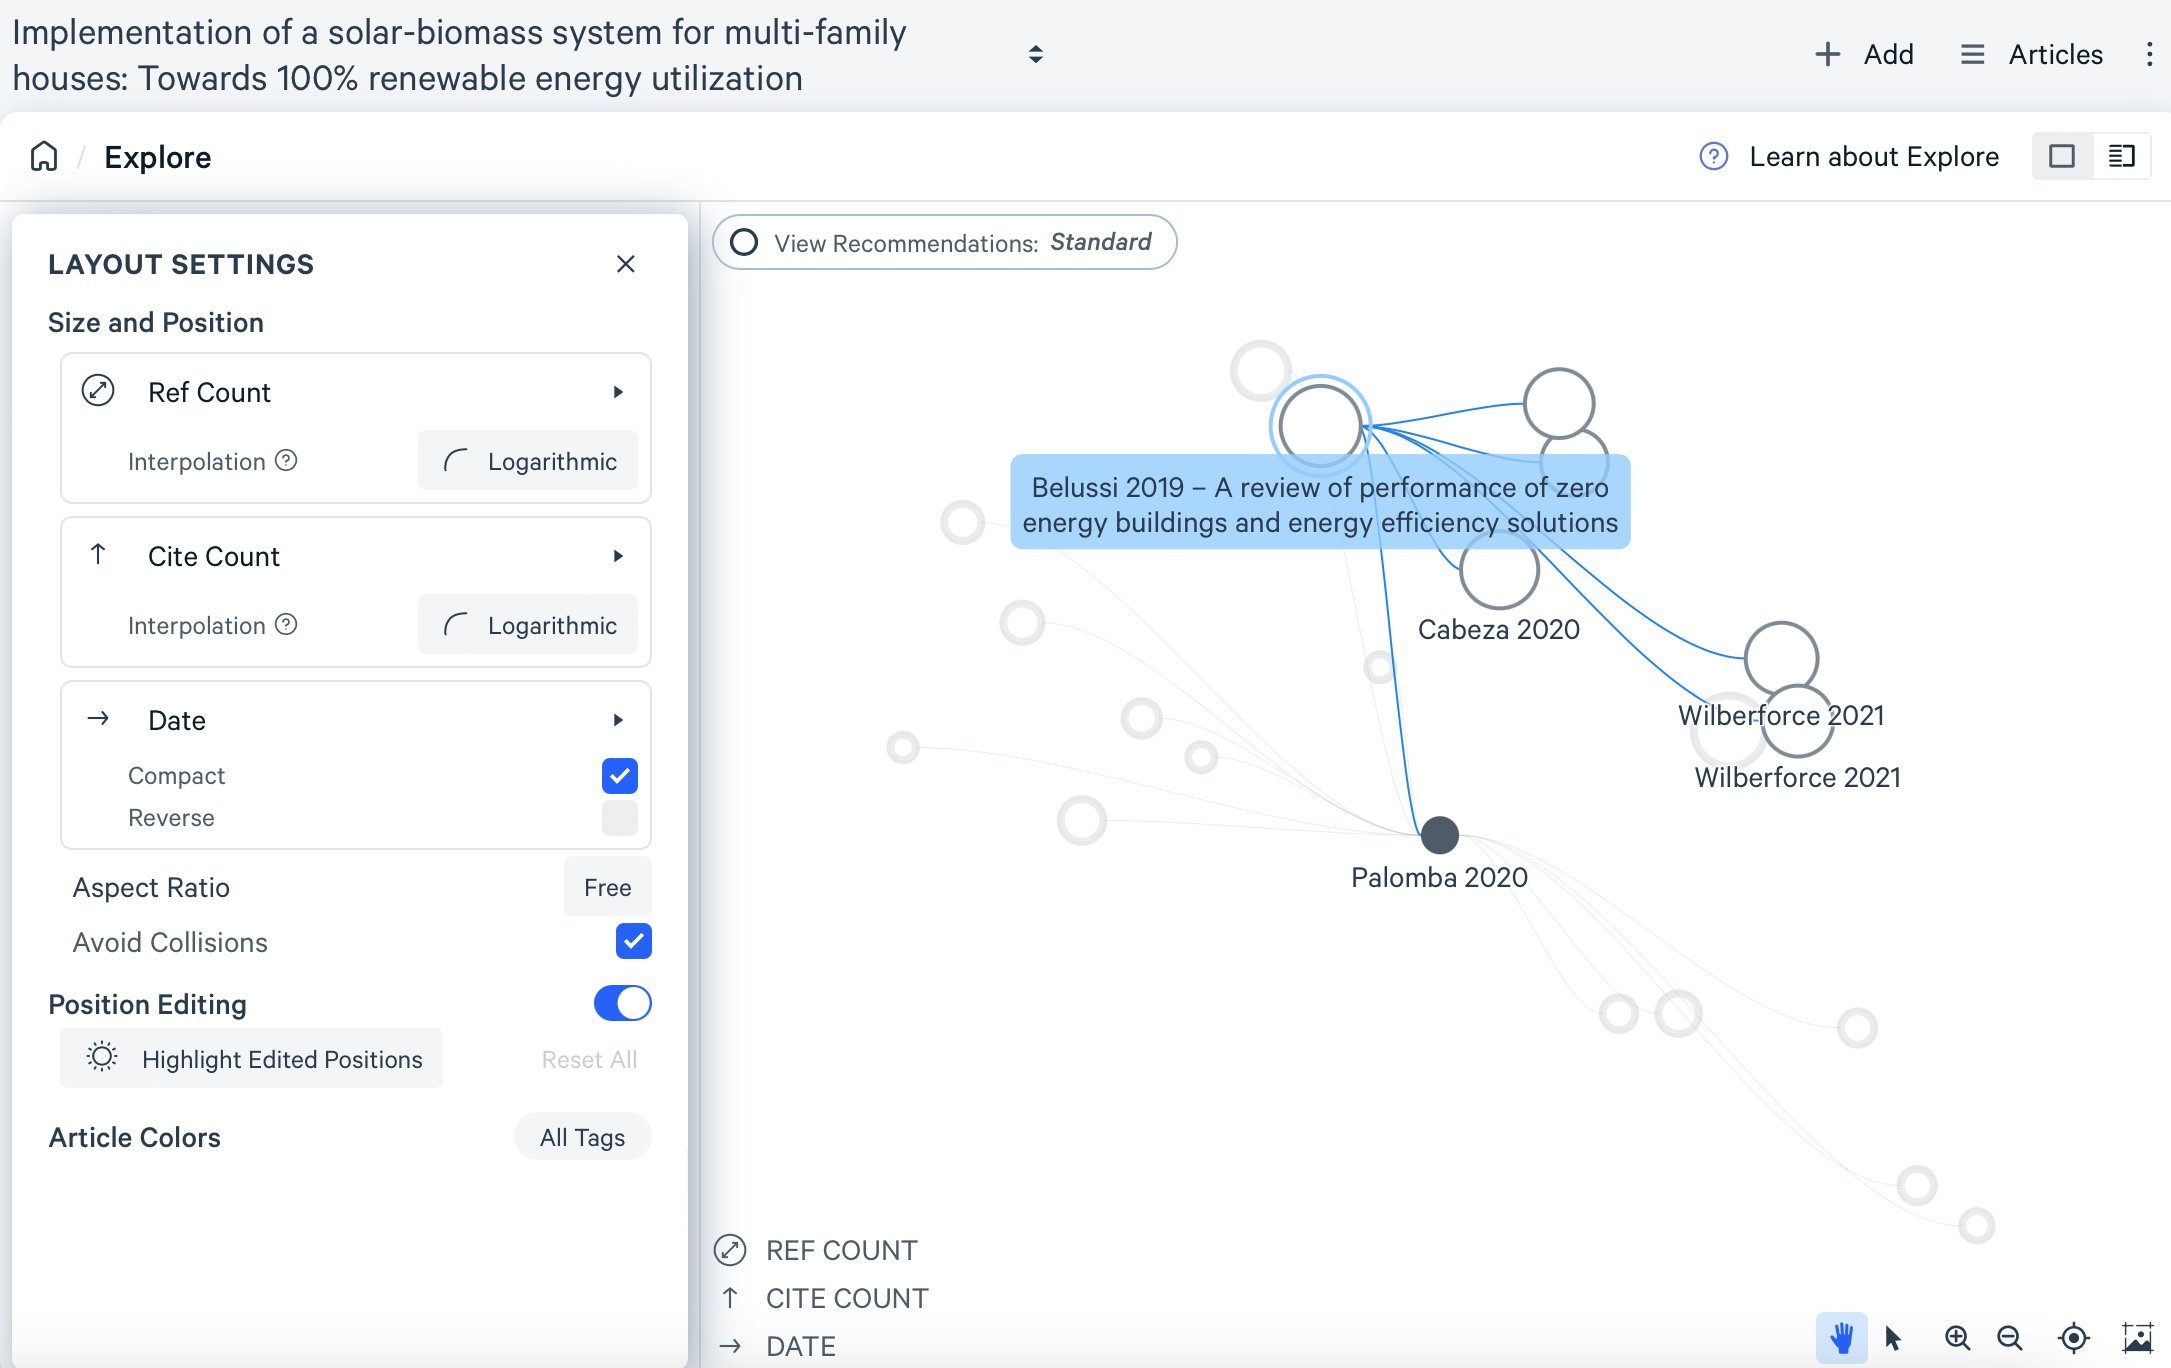
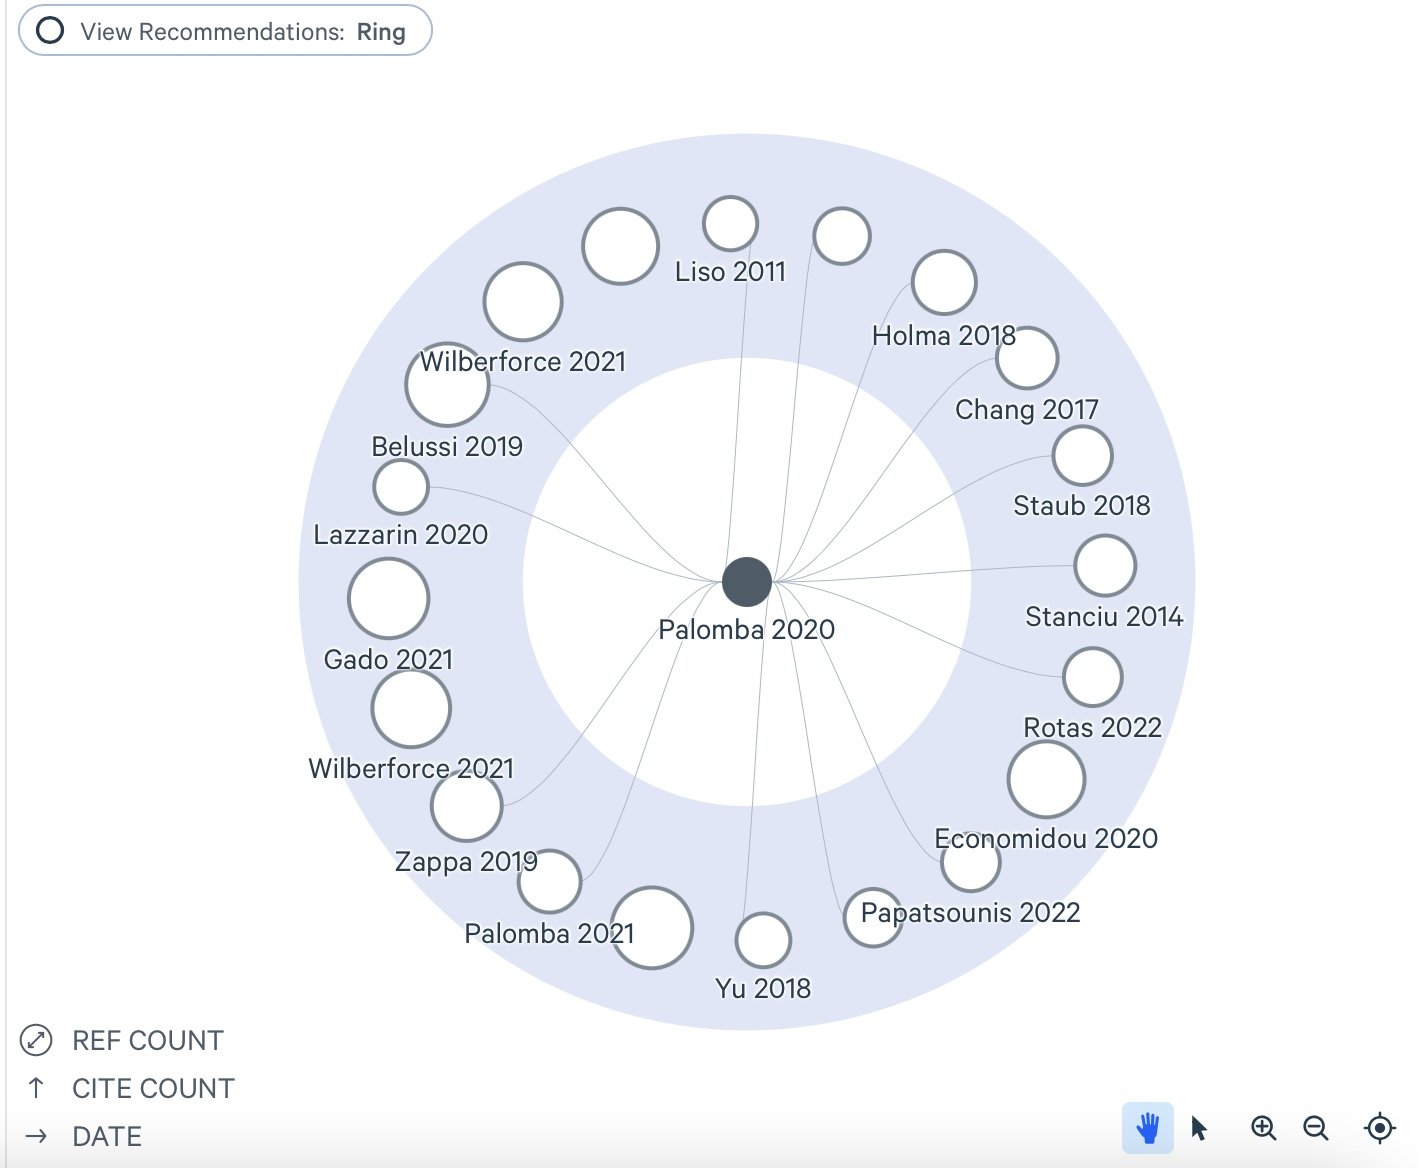
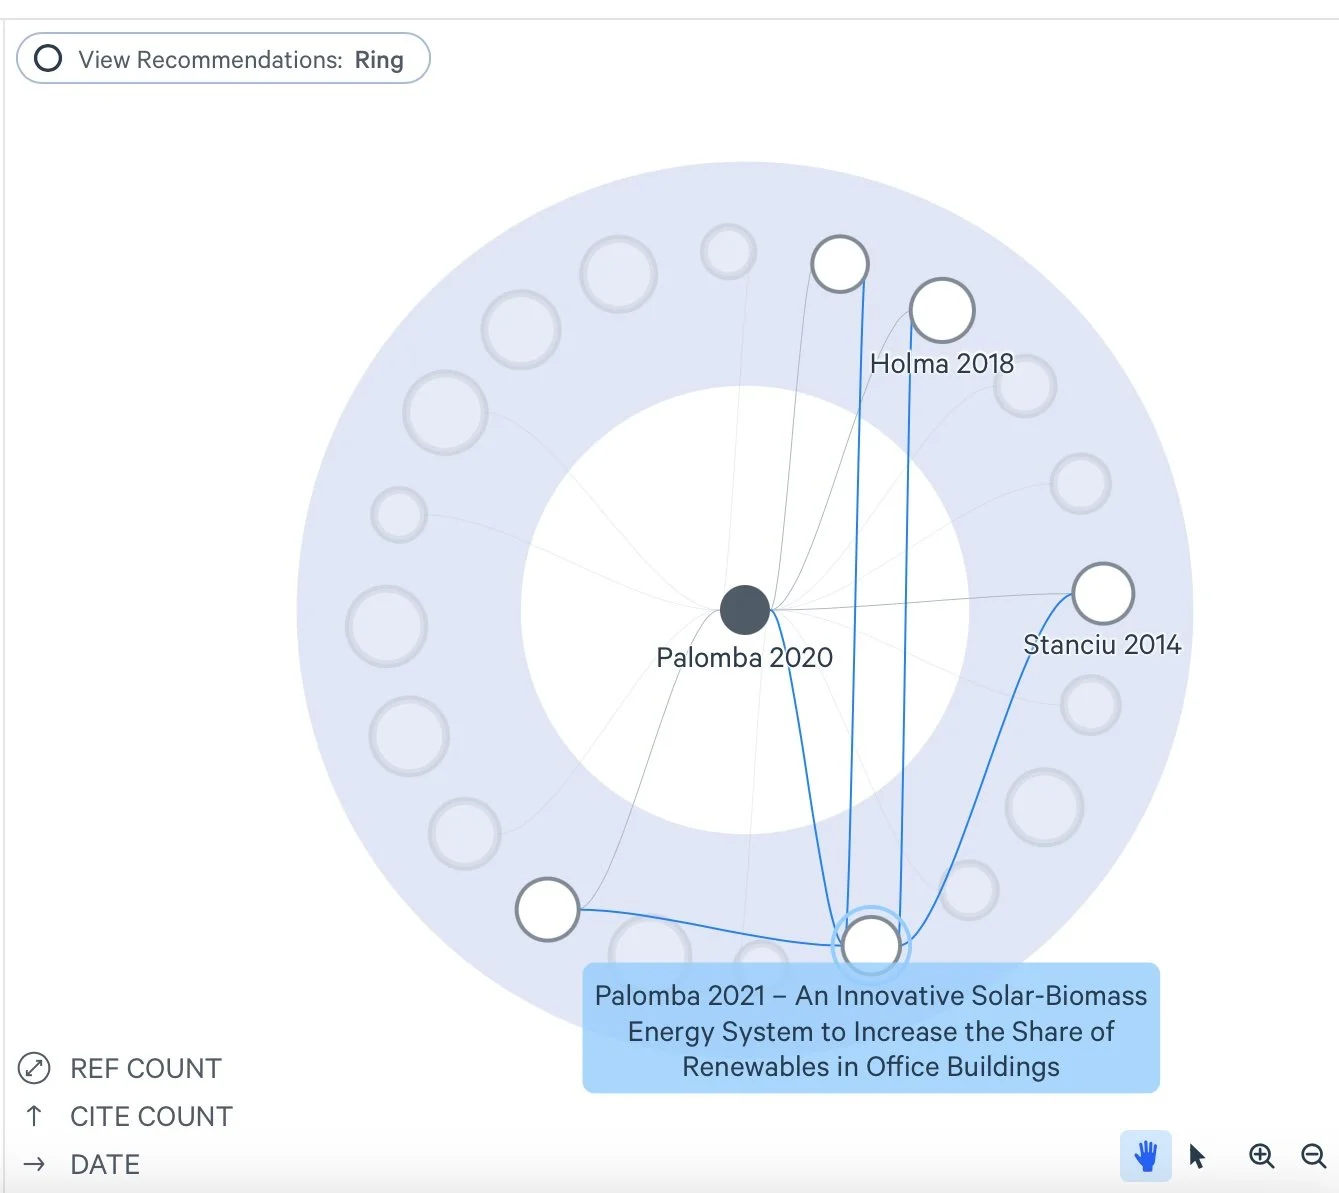
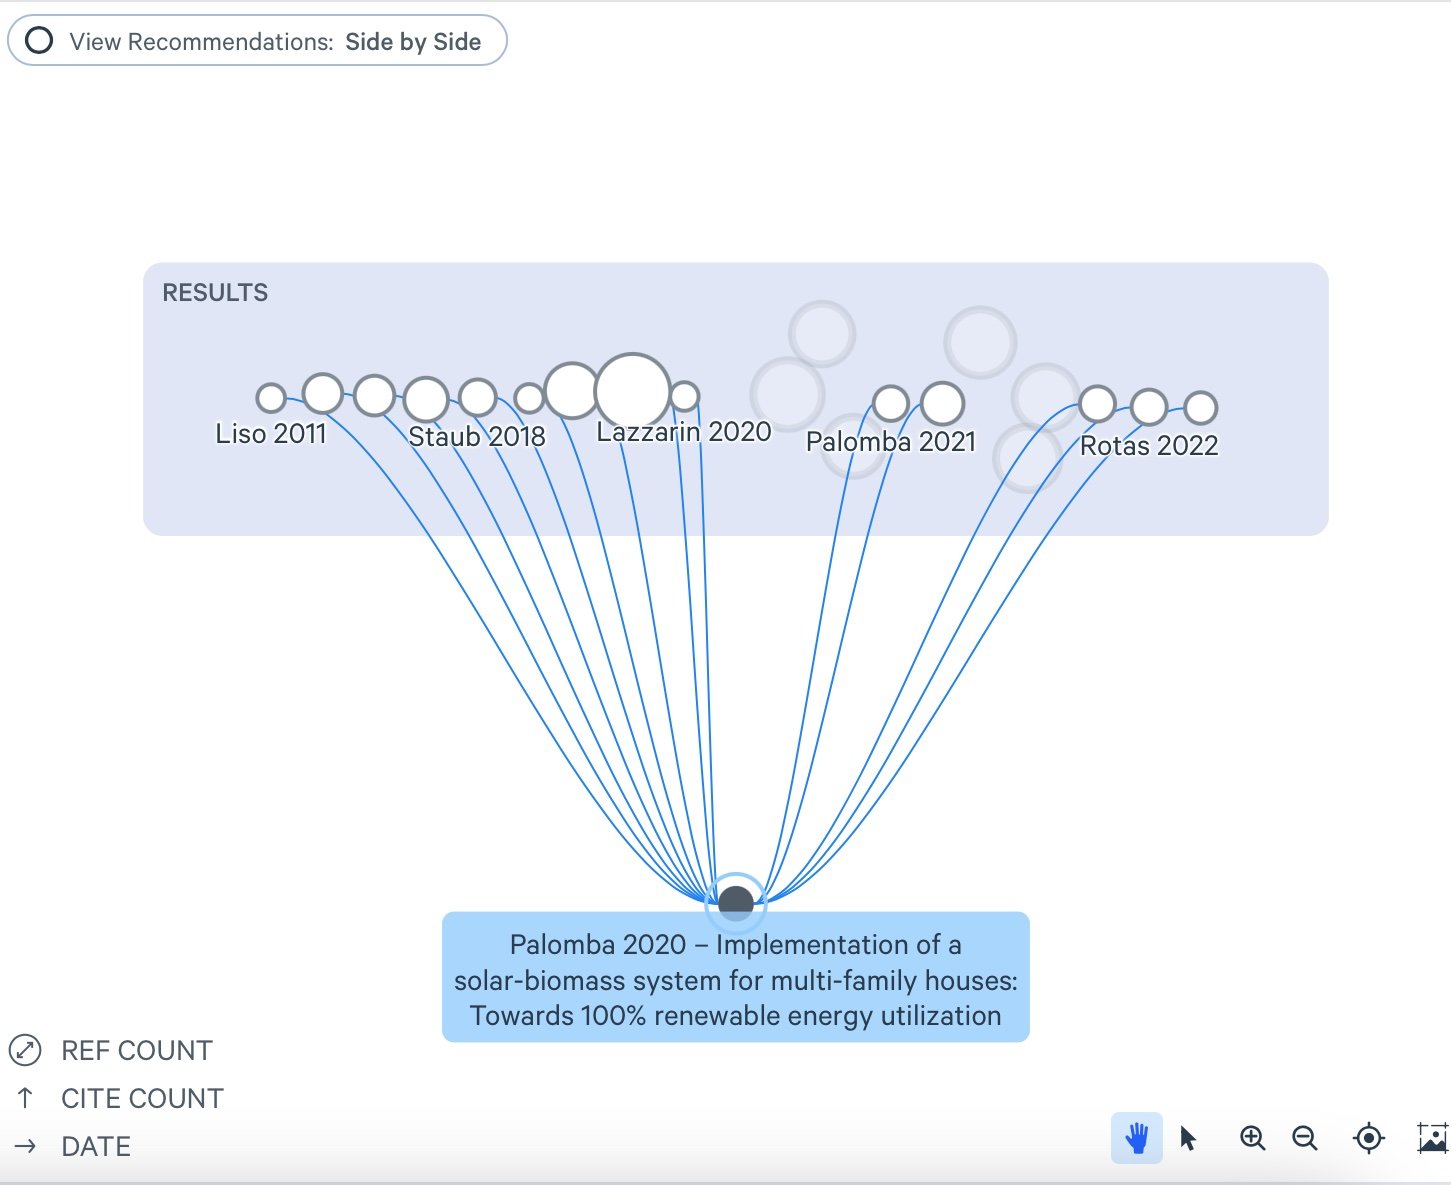
I was impressed by LitMaps' ability to visually represent both the people who cited a paper I was interested in and the references those authors used. It goes a step further by highlighting related papers—those that cite similar sources, even if they aren't directly connected to the paper you're viewing. This makes it a great tool for discovering connections you might have otherwise missed. The platform also offers a range of visualizations, from network graphs to bar charts and donut charts, allowing you to view the data in different ways.
One of the most compelling features of LitMaps is the ability to create live citation maps. These maps automatically update as new papers are published, keeping your literature review current with the latest research. This is particularly useful for long-term projects where the body of relevant work continues to evolve. While I initially explored a single paper, you can build much larger collections and visualize broader connections across multiple papers, authors, and topics. LitMaps offers a flexible and engaging way to build out a literature review, helping you track key papers and uncover new ones that might be critical to your work.

Next up: Connected Papers
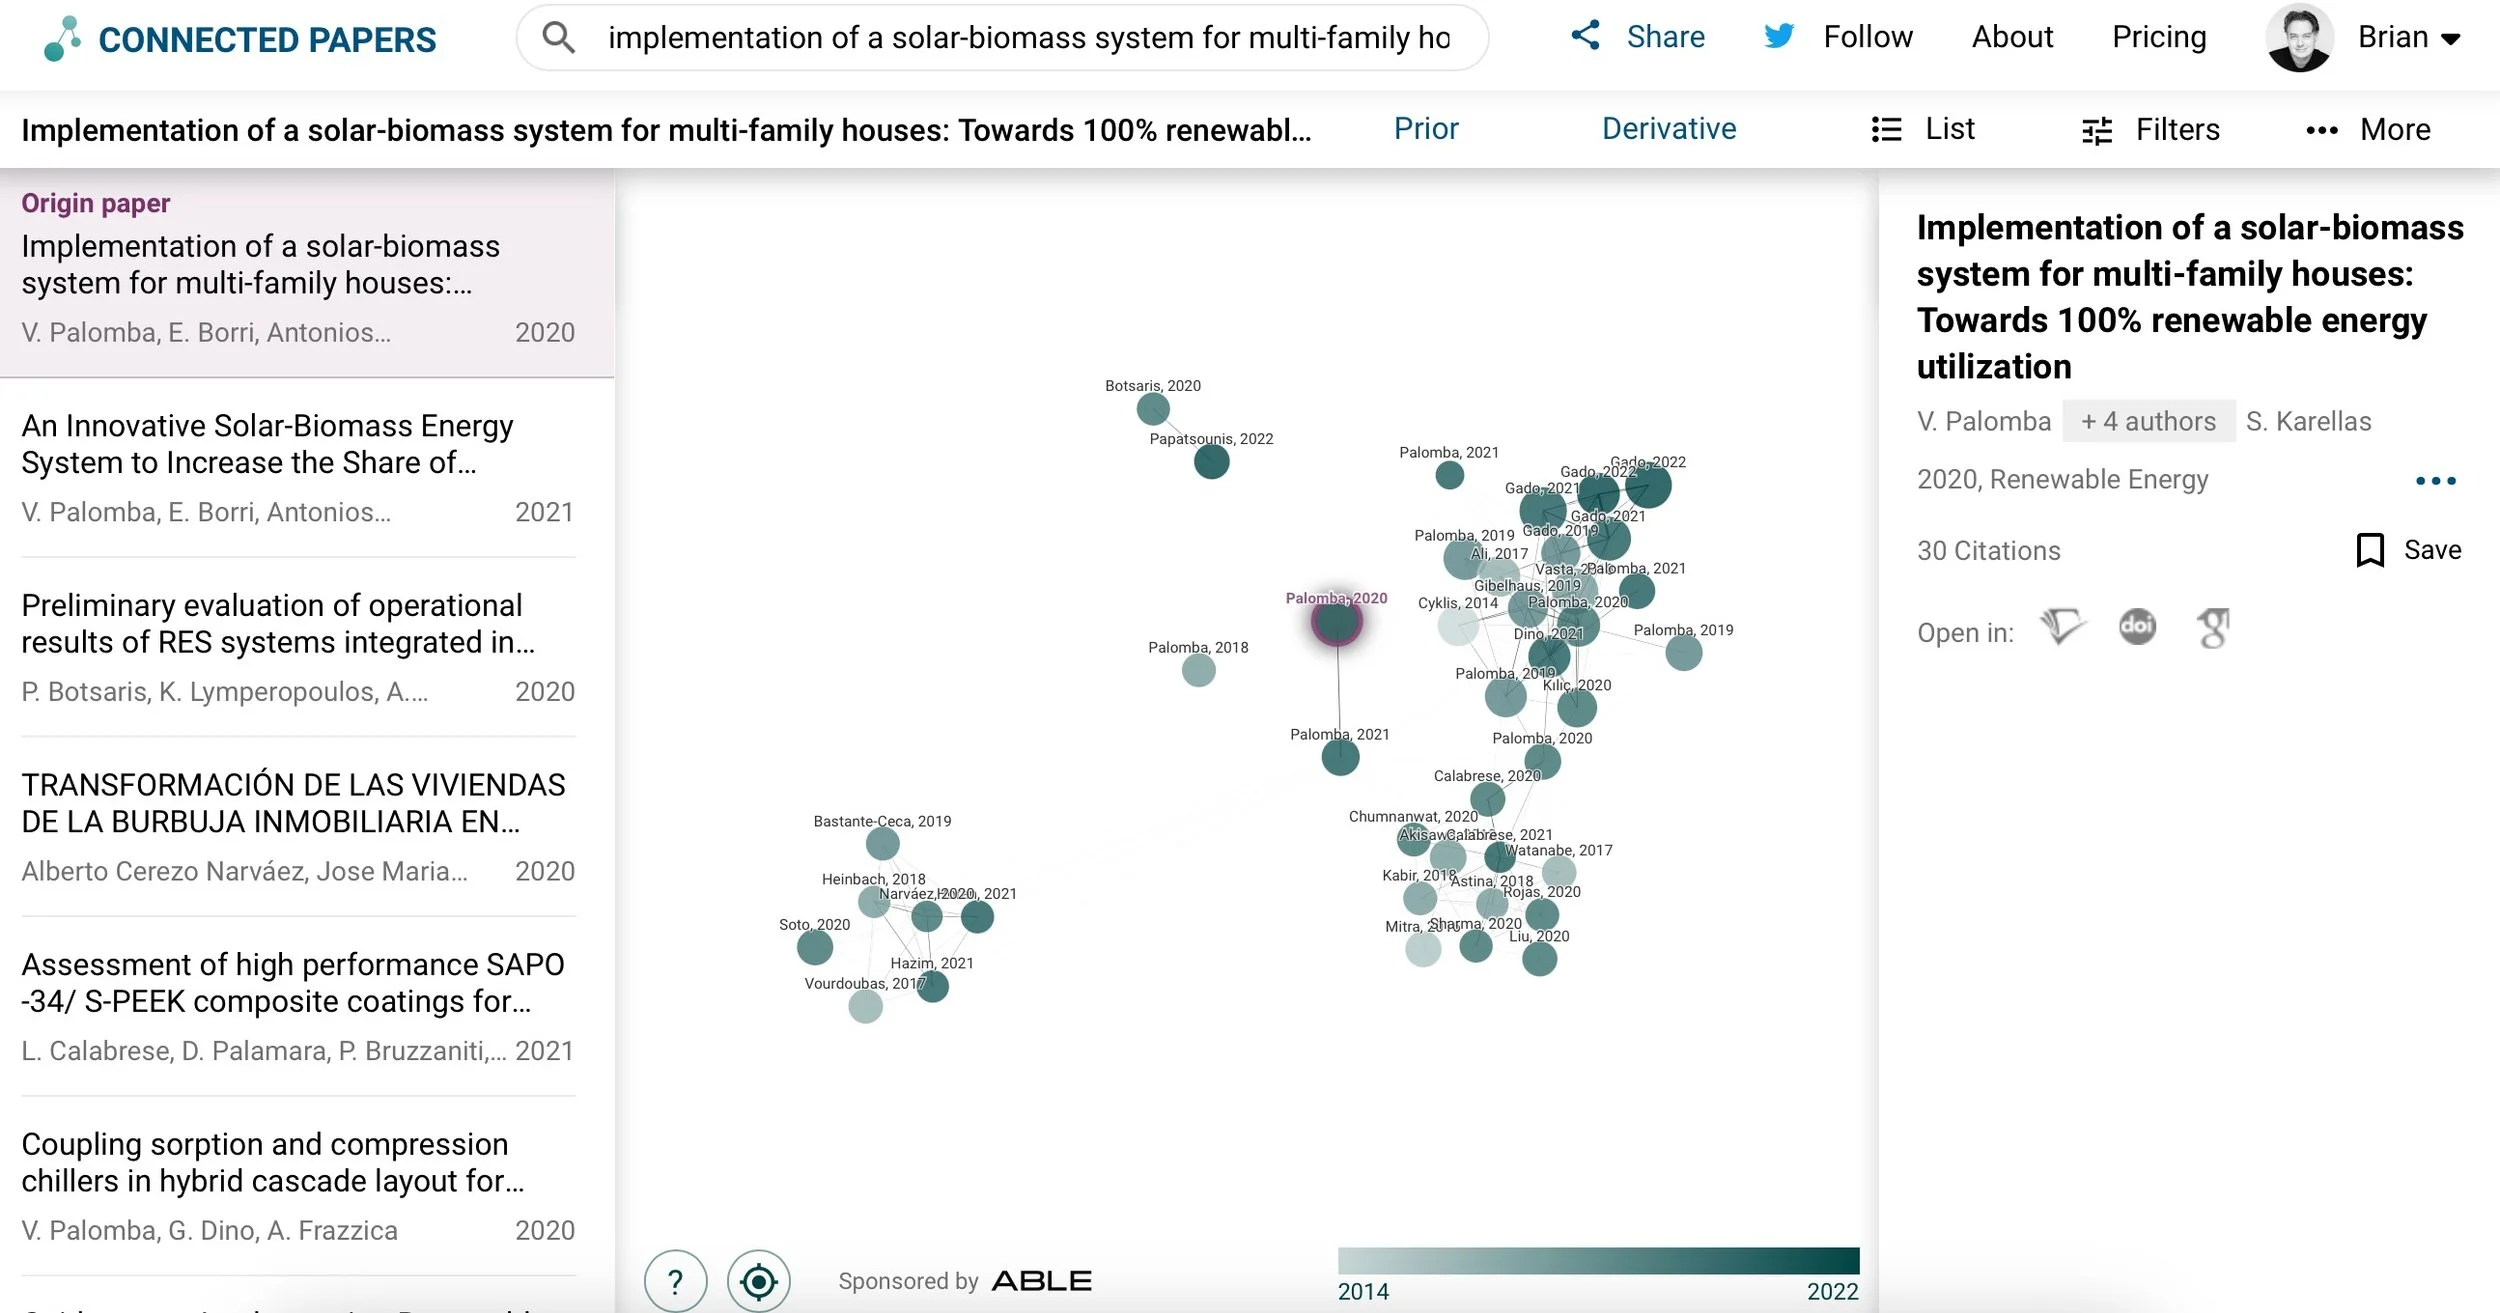
Connected Papers also offers a network map interface, but what sets it apart is that it doesn’t just focus on references or cited works. Instead, it highlights related papers that may not be directly cited but are still relevant based on topic similarity. This broader view helps uncover connections you might otherwise miss, offering a richer exploration of adjacent research. The platform also provides lists of prior works (influential papers) and derived works (papers influenced by the one you’re viewing), giving you a complete picture of a paper’s academic impact. Its interactive interface makes it easy to navigate complex research networks, making it a valuable tool for expanding beyond core papers and understanding the broader research landscape.


Next: Research Rabbit
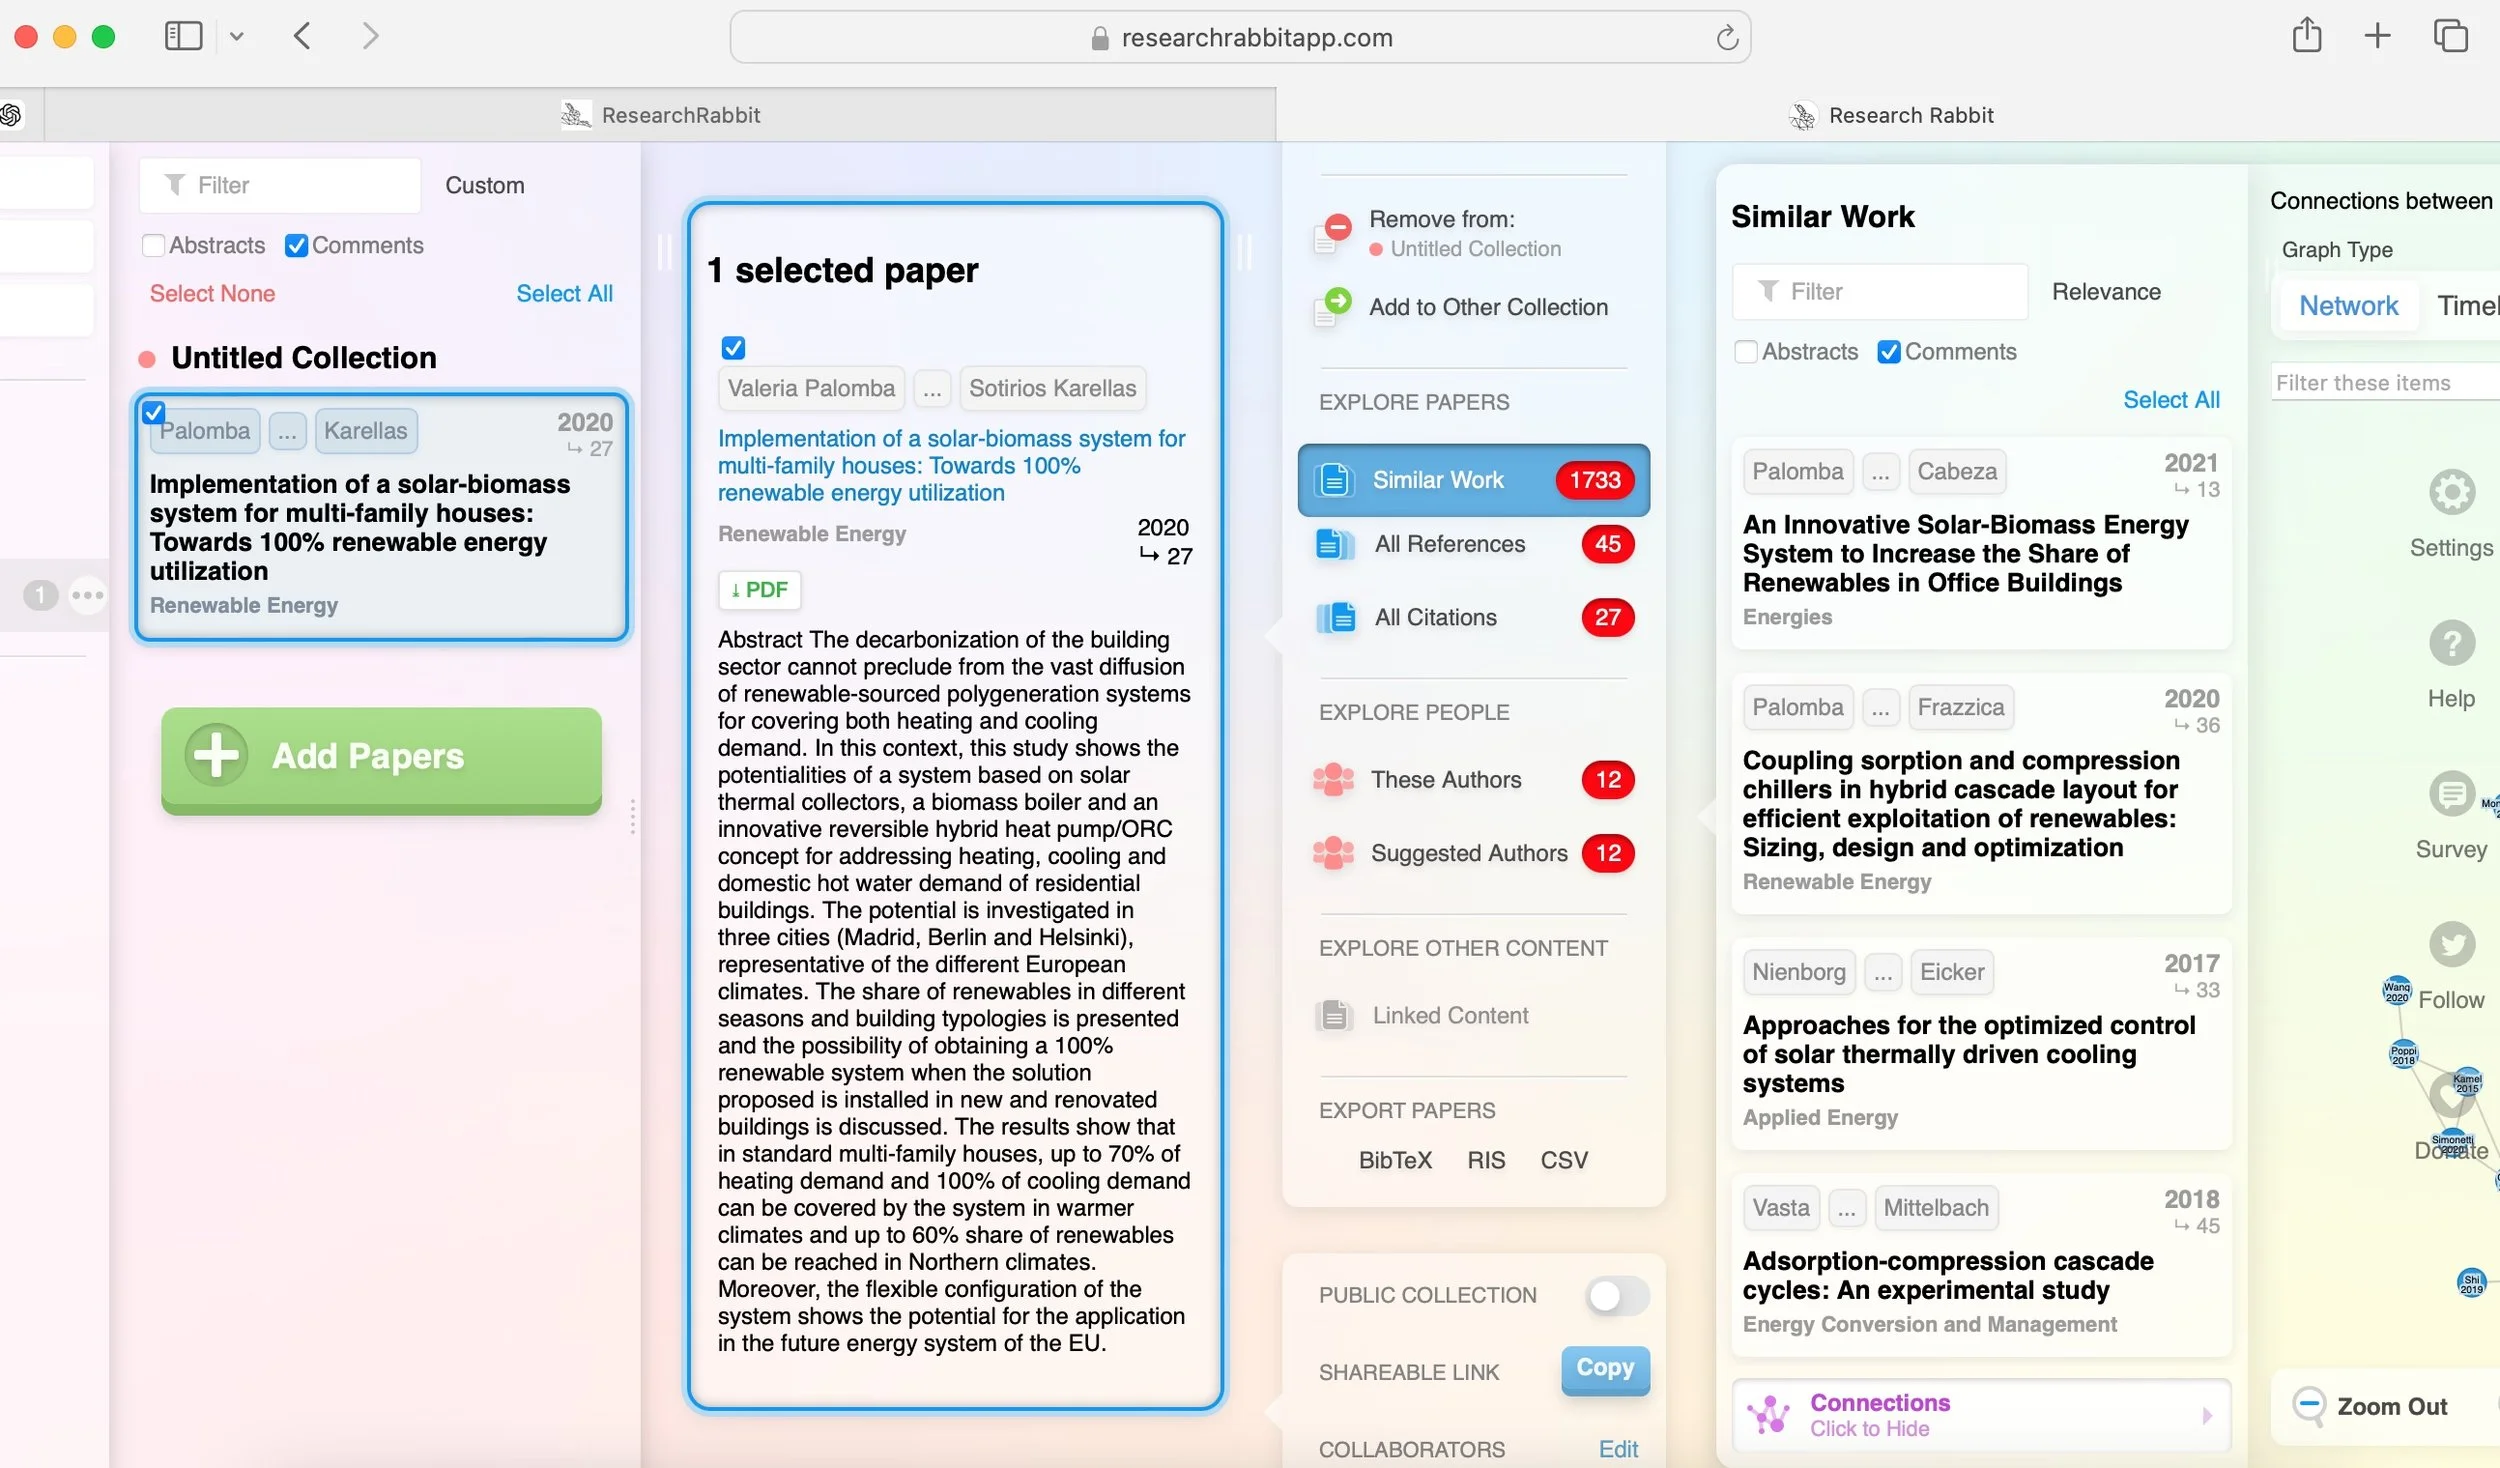
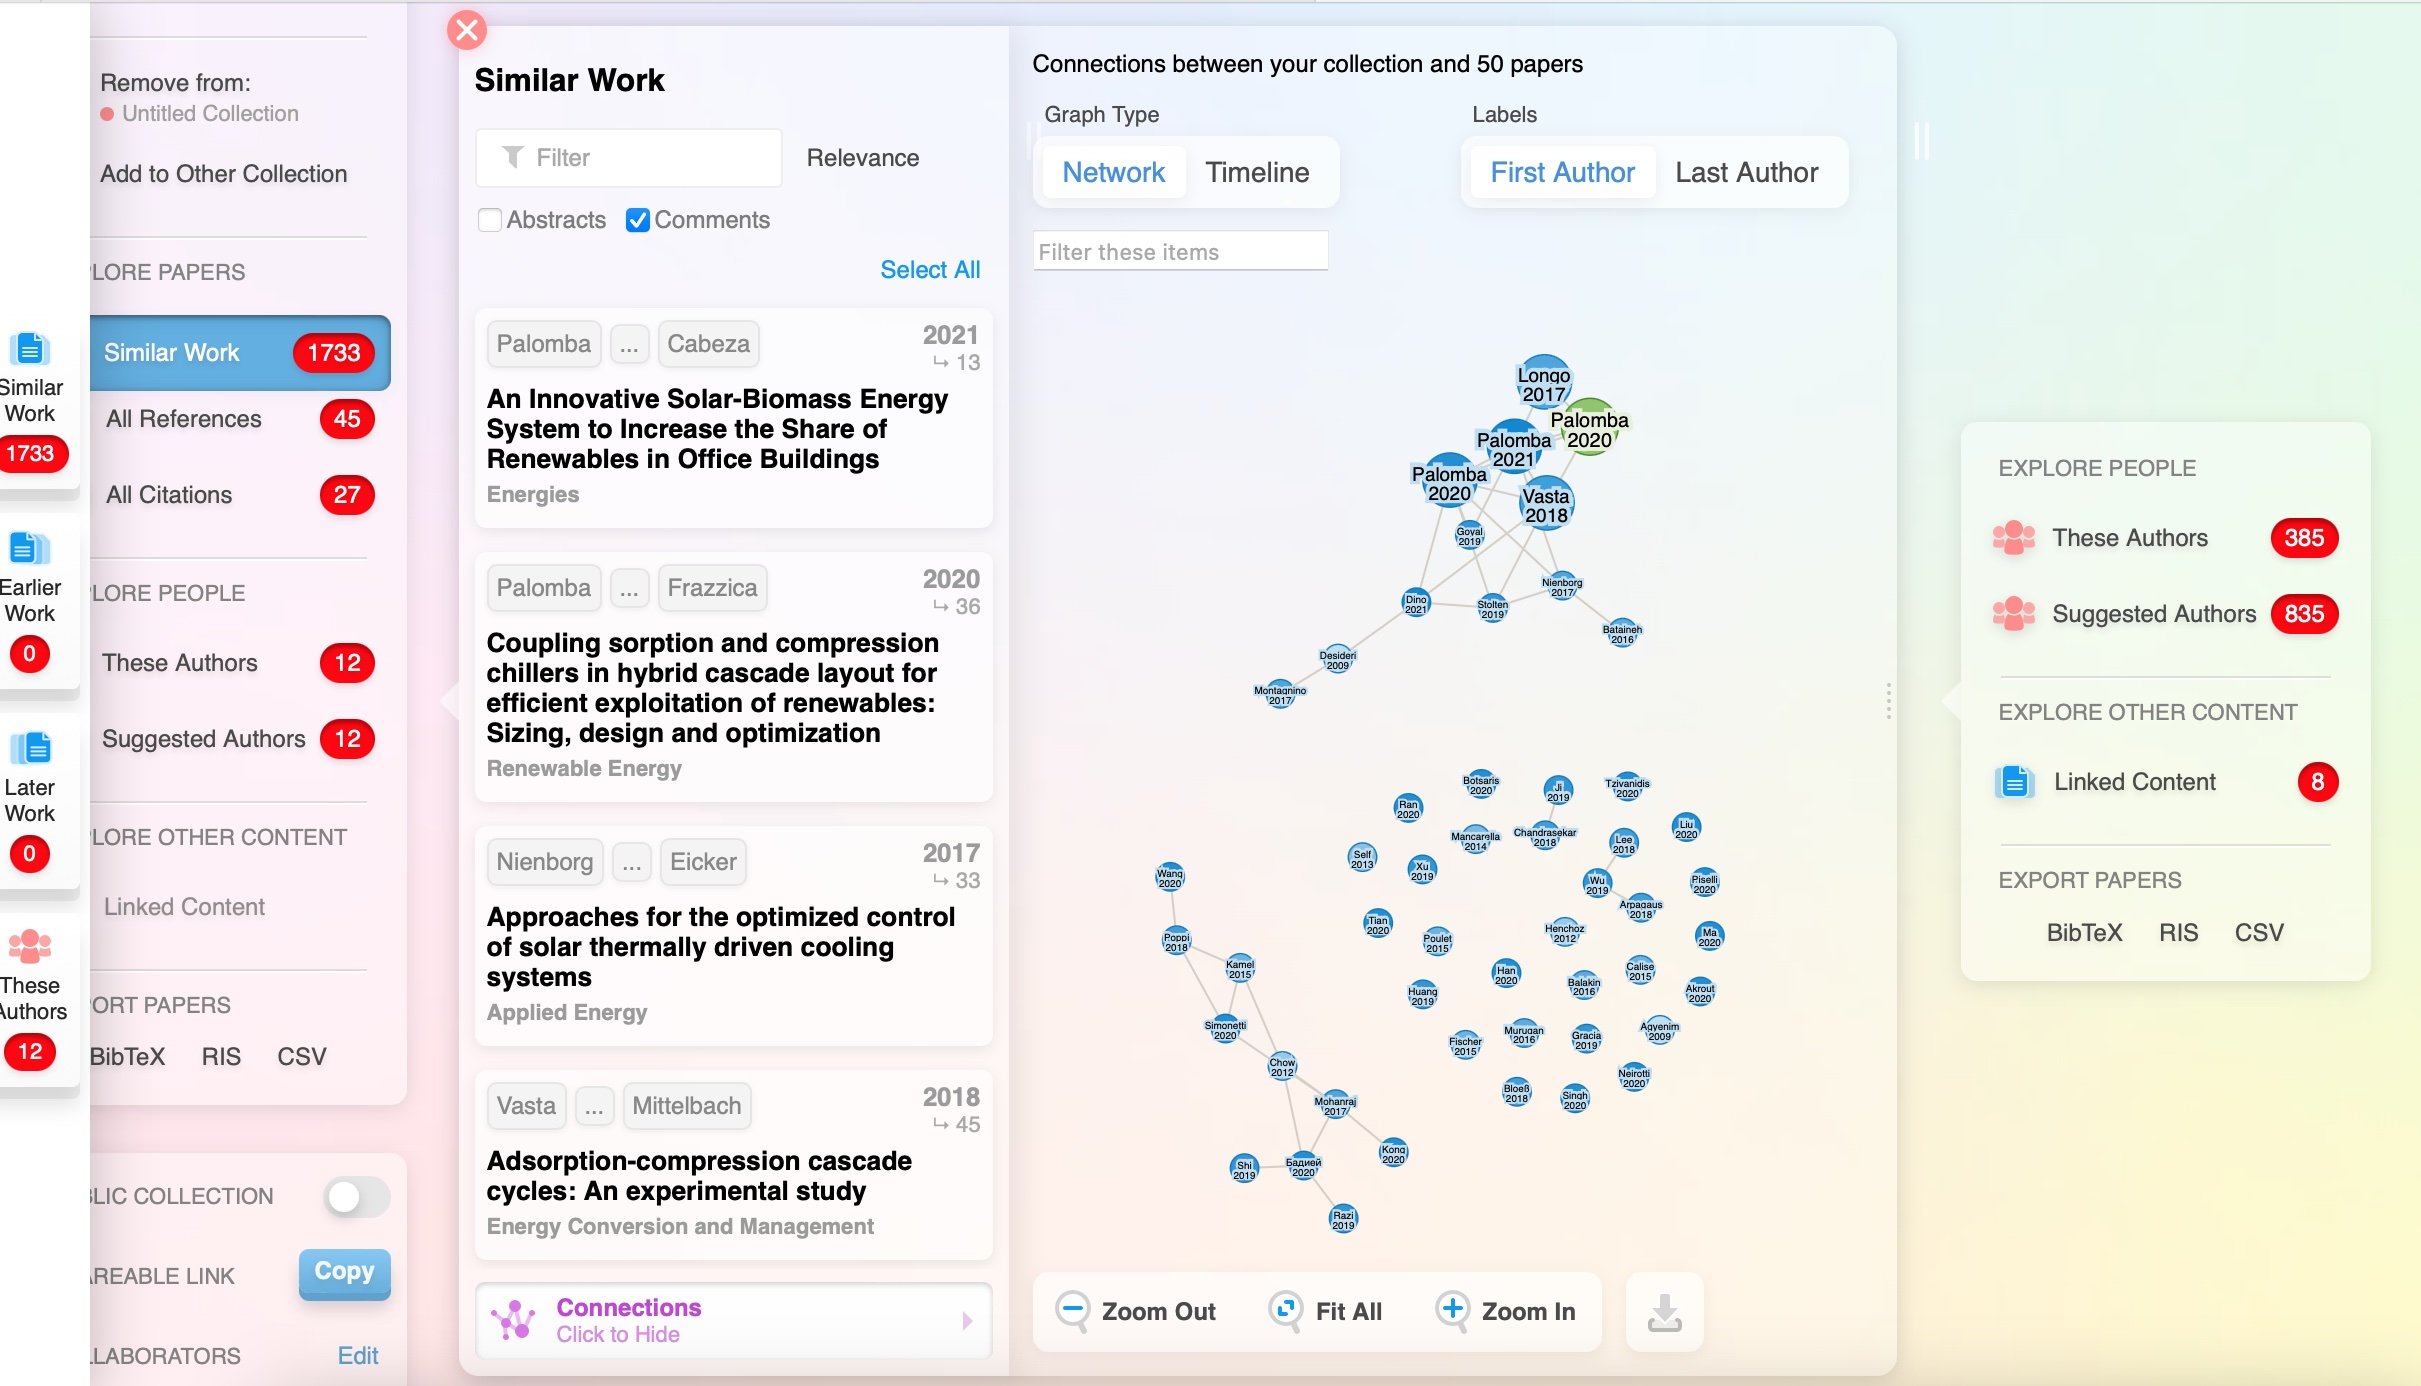
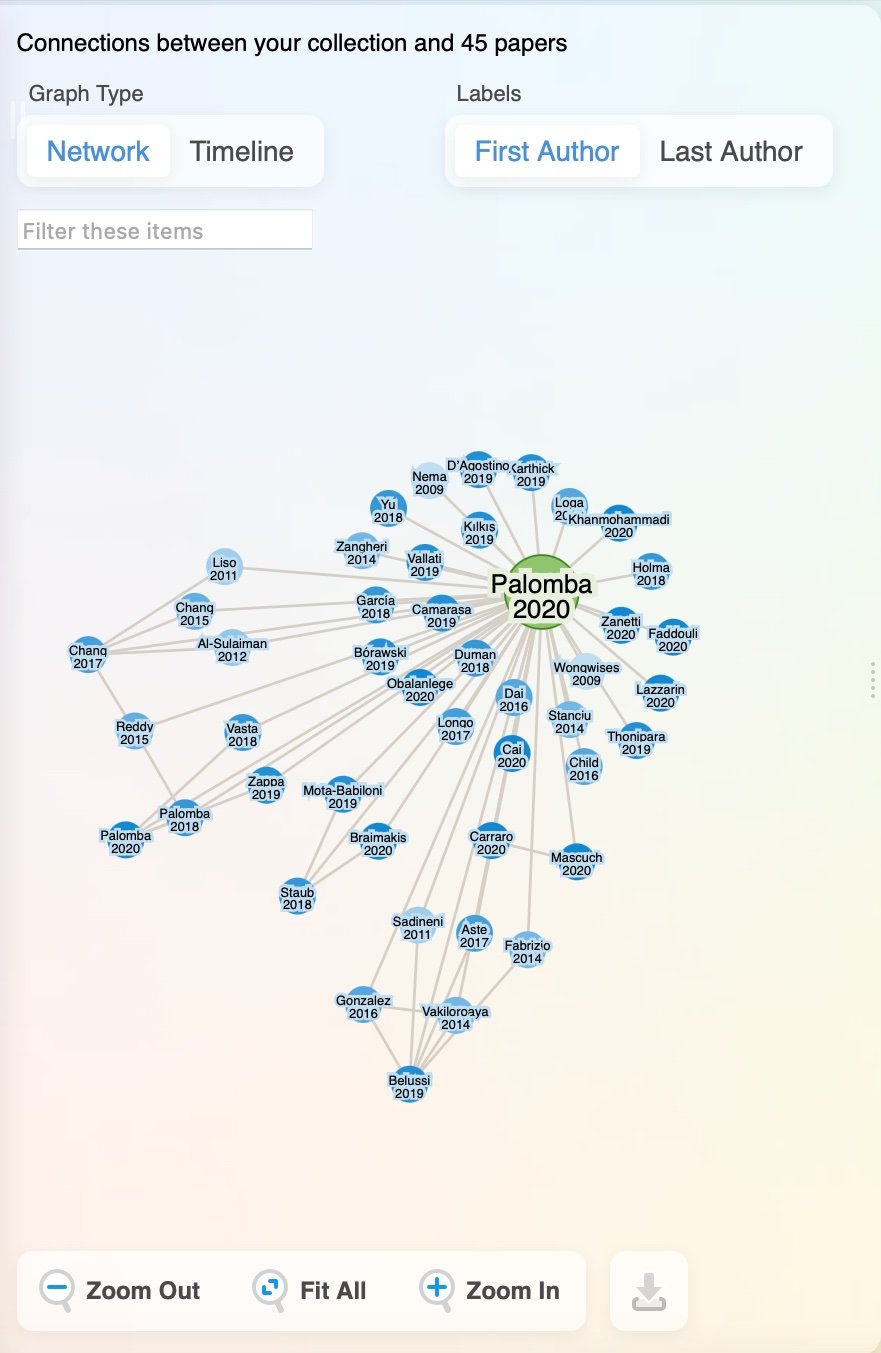
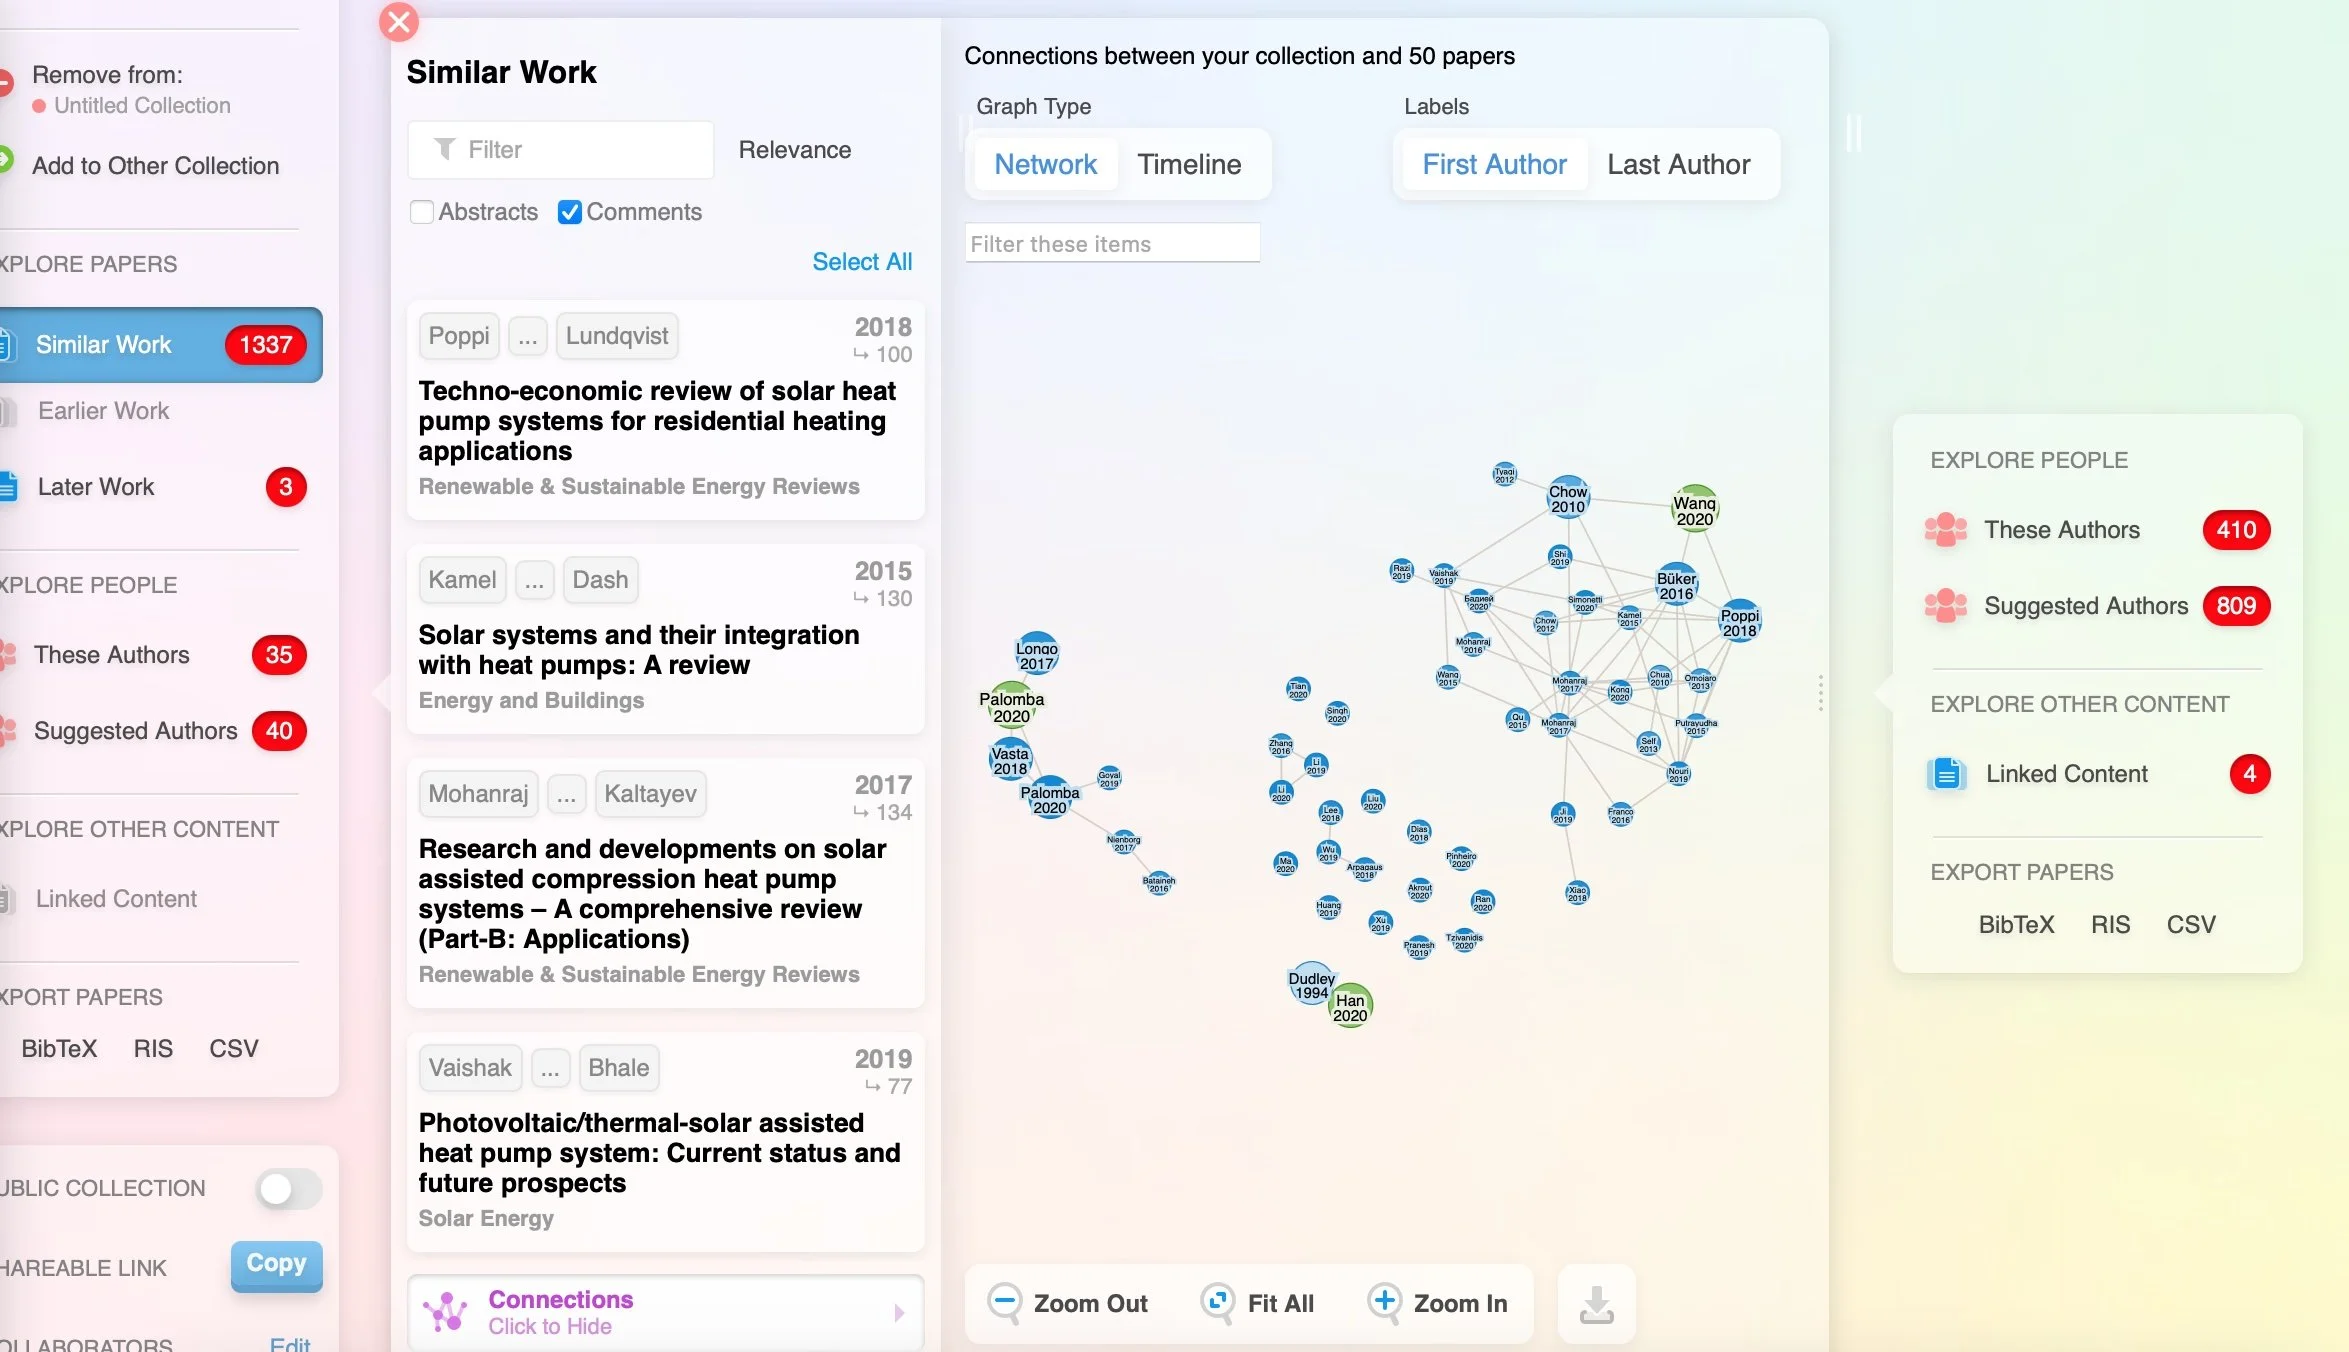
Research Rabbit also offers network mapping functionality, but its interface stands out by using a Trello-like panel or board framework. Unlike the traditional vertical search experience we're accustomed to, Research Rabbit creates a more horizontal flow. New information appears to the right as you explore, and you can scroll back to the left to revisit previous papers or data. This unique layout provides a fresh, more visual way to interact with research, making the exploration of related works feel intuitive and dynamic.
The platform’s board structure allows for easy organization of papers, helping users visually group related works or track ongoing literature searches. Its dynamic updates provide a living, evolving view of research topics, automatically suggesting new, relevant papers as they become available. This makes Research Rabbit particularly useful for systematic reviews or staying current in fast-moving fields. Additionally, its collaborative features allow research teams to share boards, fostering a more interactive and collective approach to literature discovery. The combination of intuitive design and powerful capabilities streamlines research workflows and enhances the discovery process.

Next up: R Discovery
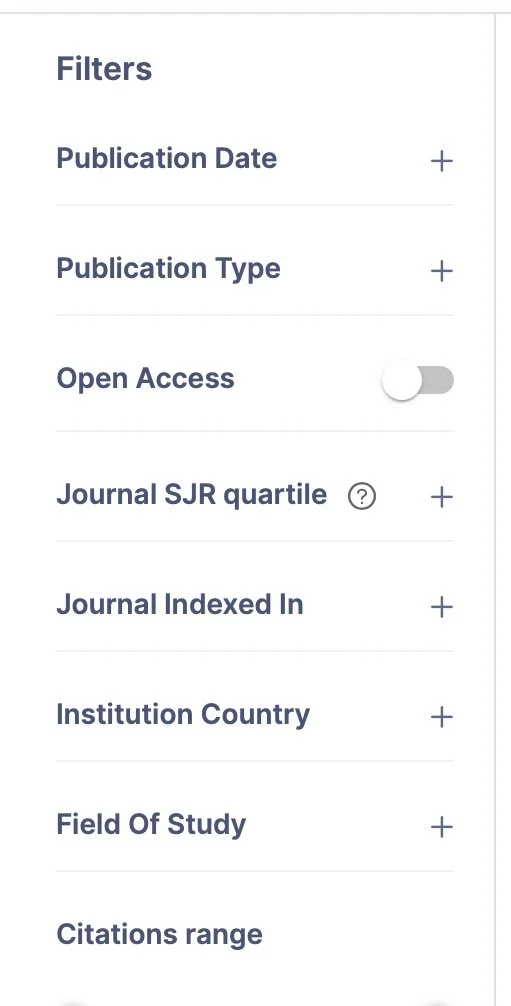
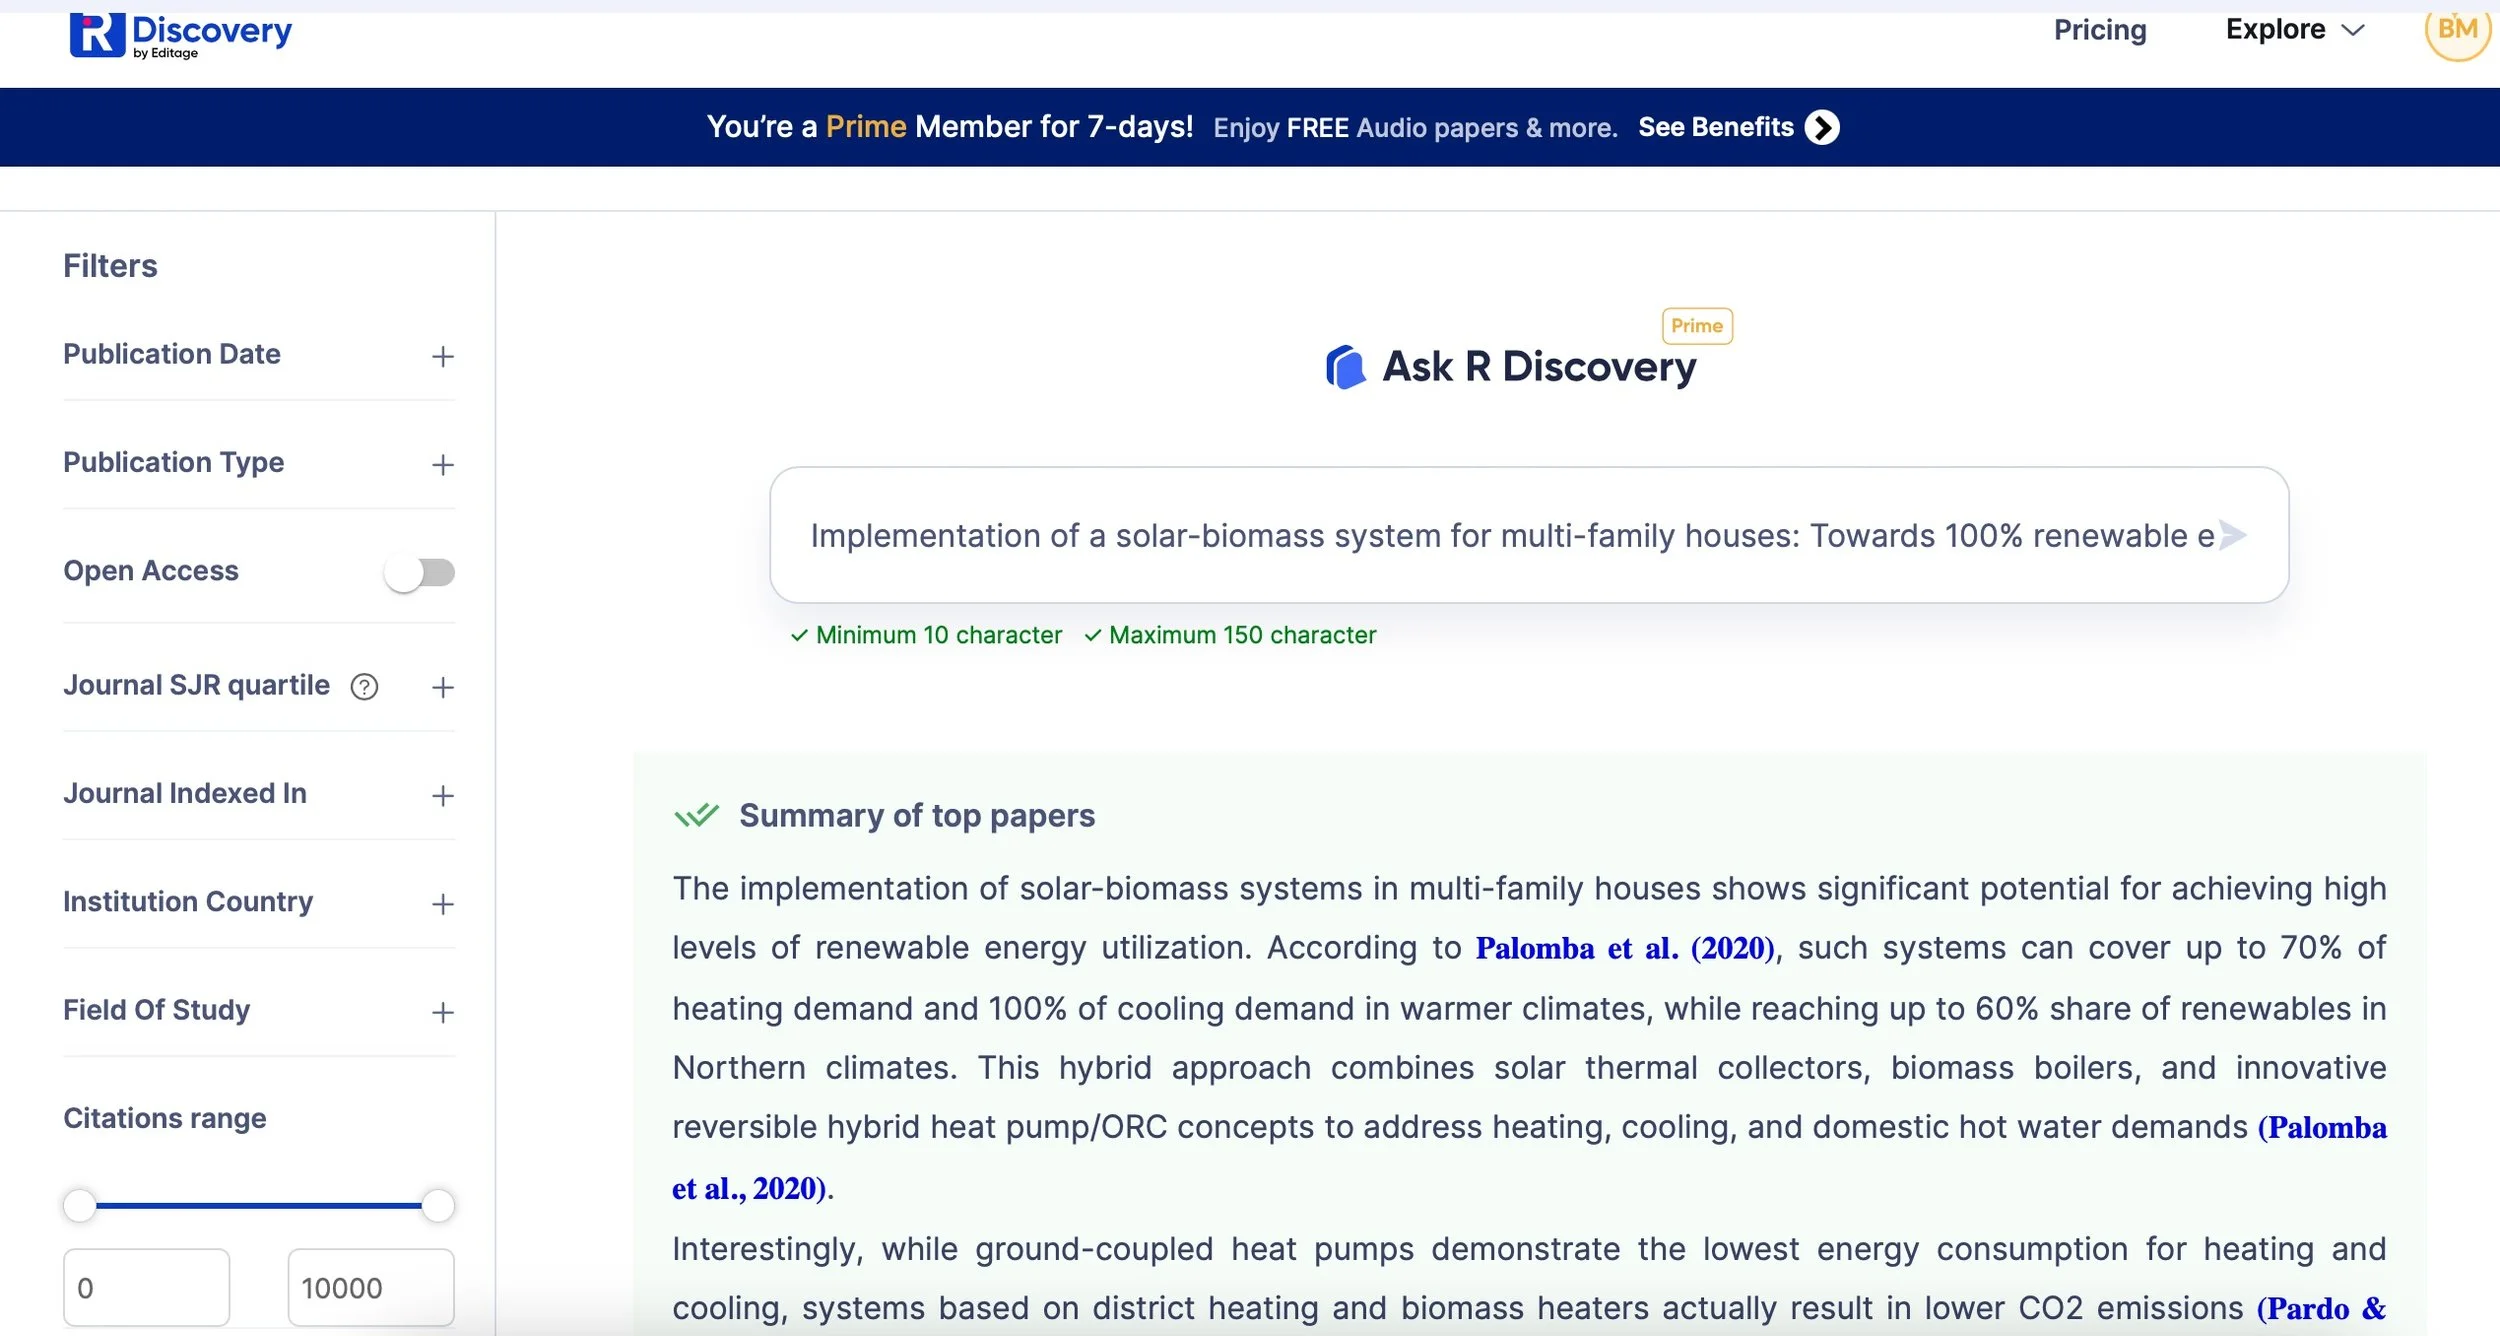
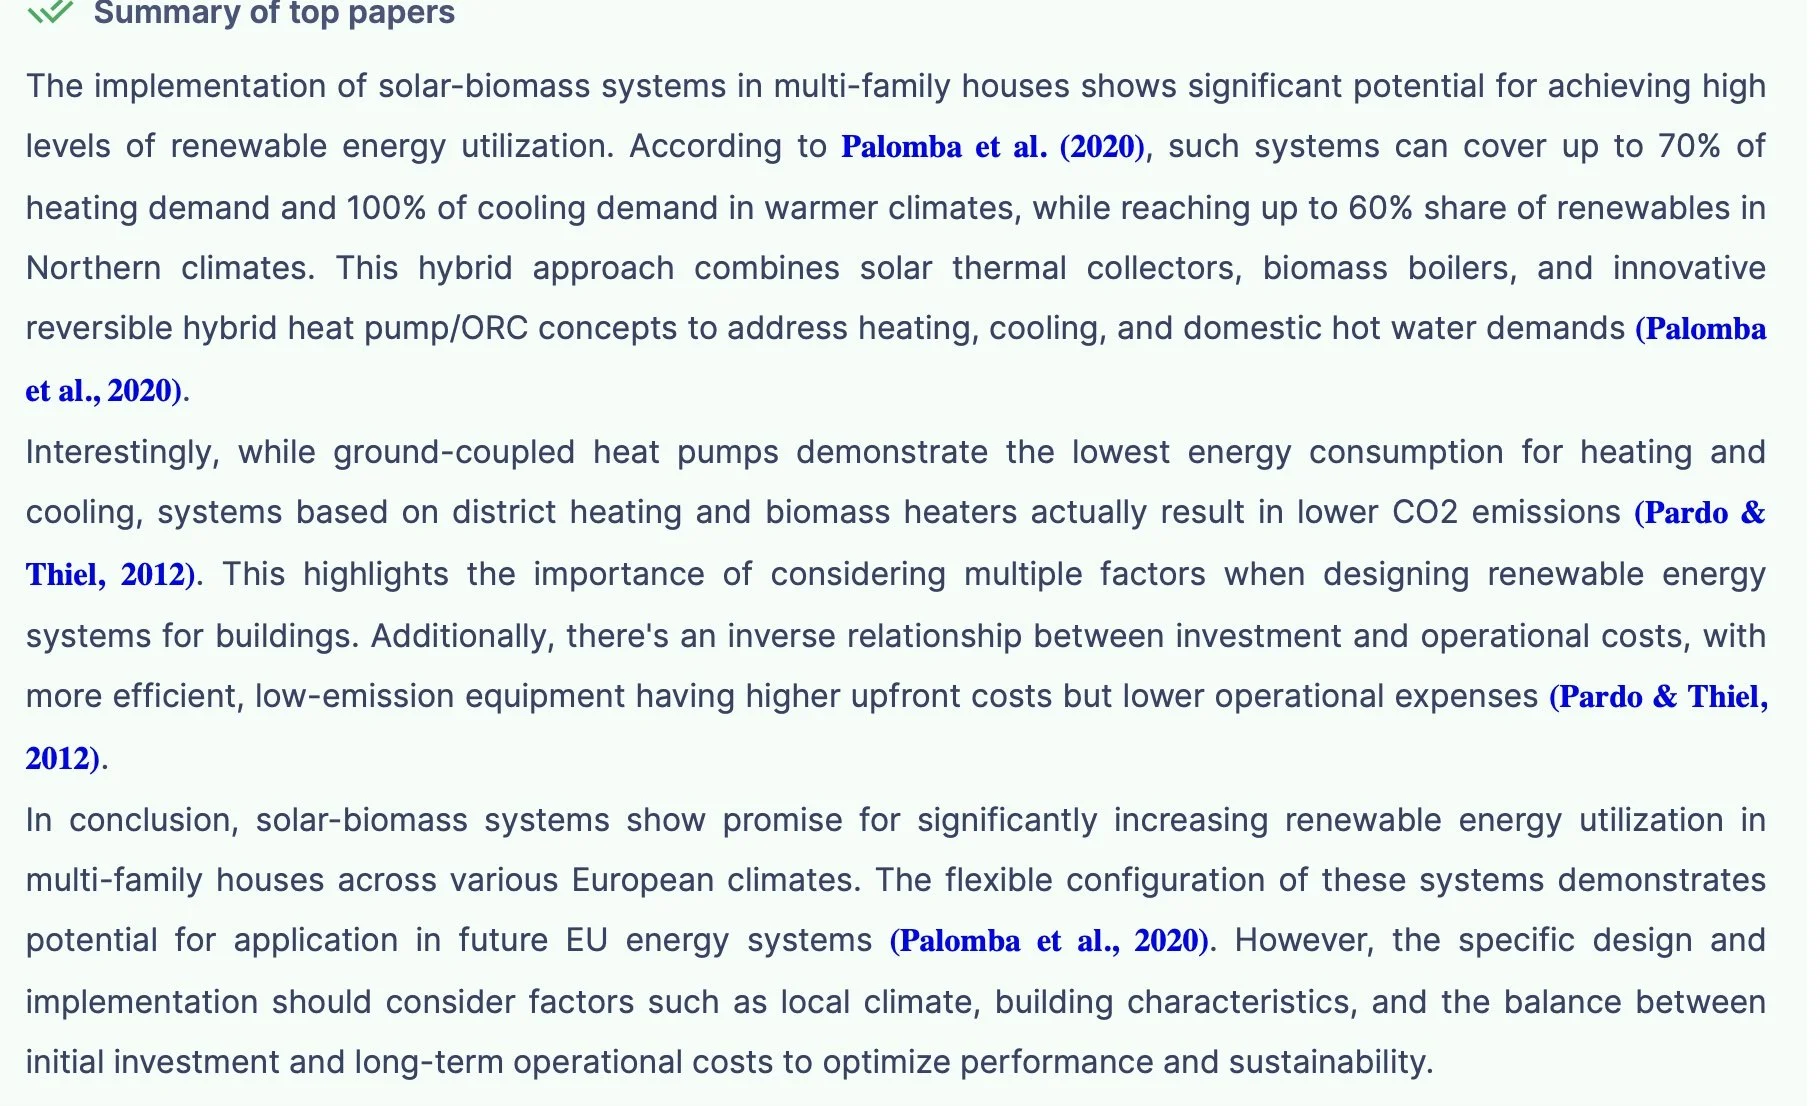
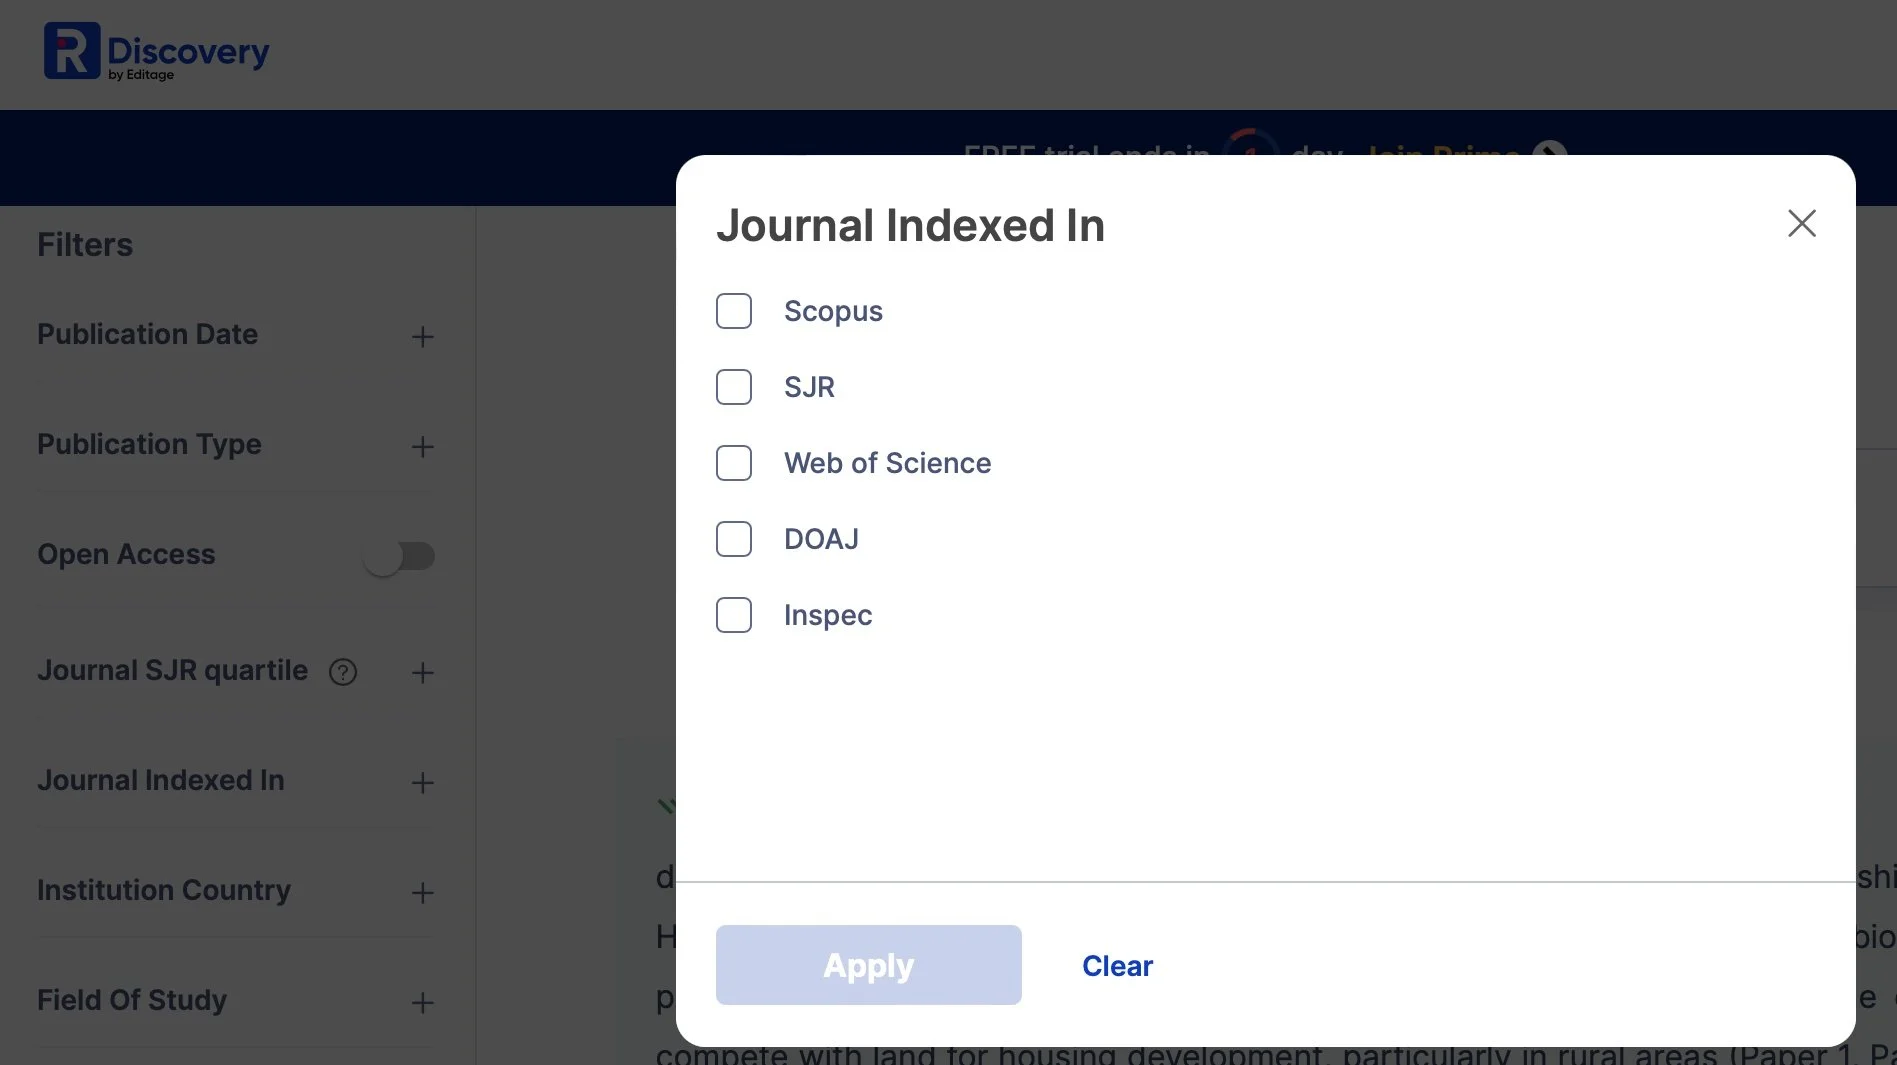
R Discovery offered a free trial with Amazon Prime access, and it felt the most “corporate” of all the tools I tried. Unlike the others, which focus on mapping and connecting authors and papers, R Discovery generates text summaries based on your topic. This was useful for quickly getting an overview or answering a specific question. What stood out to me was the filtering options—you can sort by dates, countries, fields of study, journal rankings, and more. The summaries adjust based on your selections, as they draw from different papers. This is particularly helpful for topics like biofuels, which might be framed differently depending on the region—such as a focus on biodiesel in India versus ethanol in Brazil.
And then: Scite_
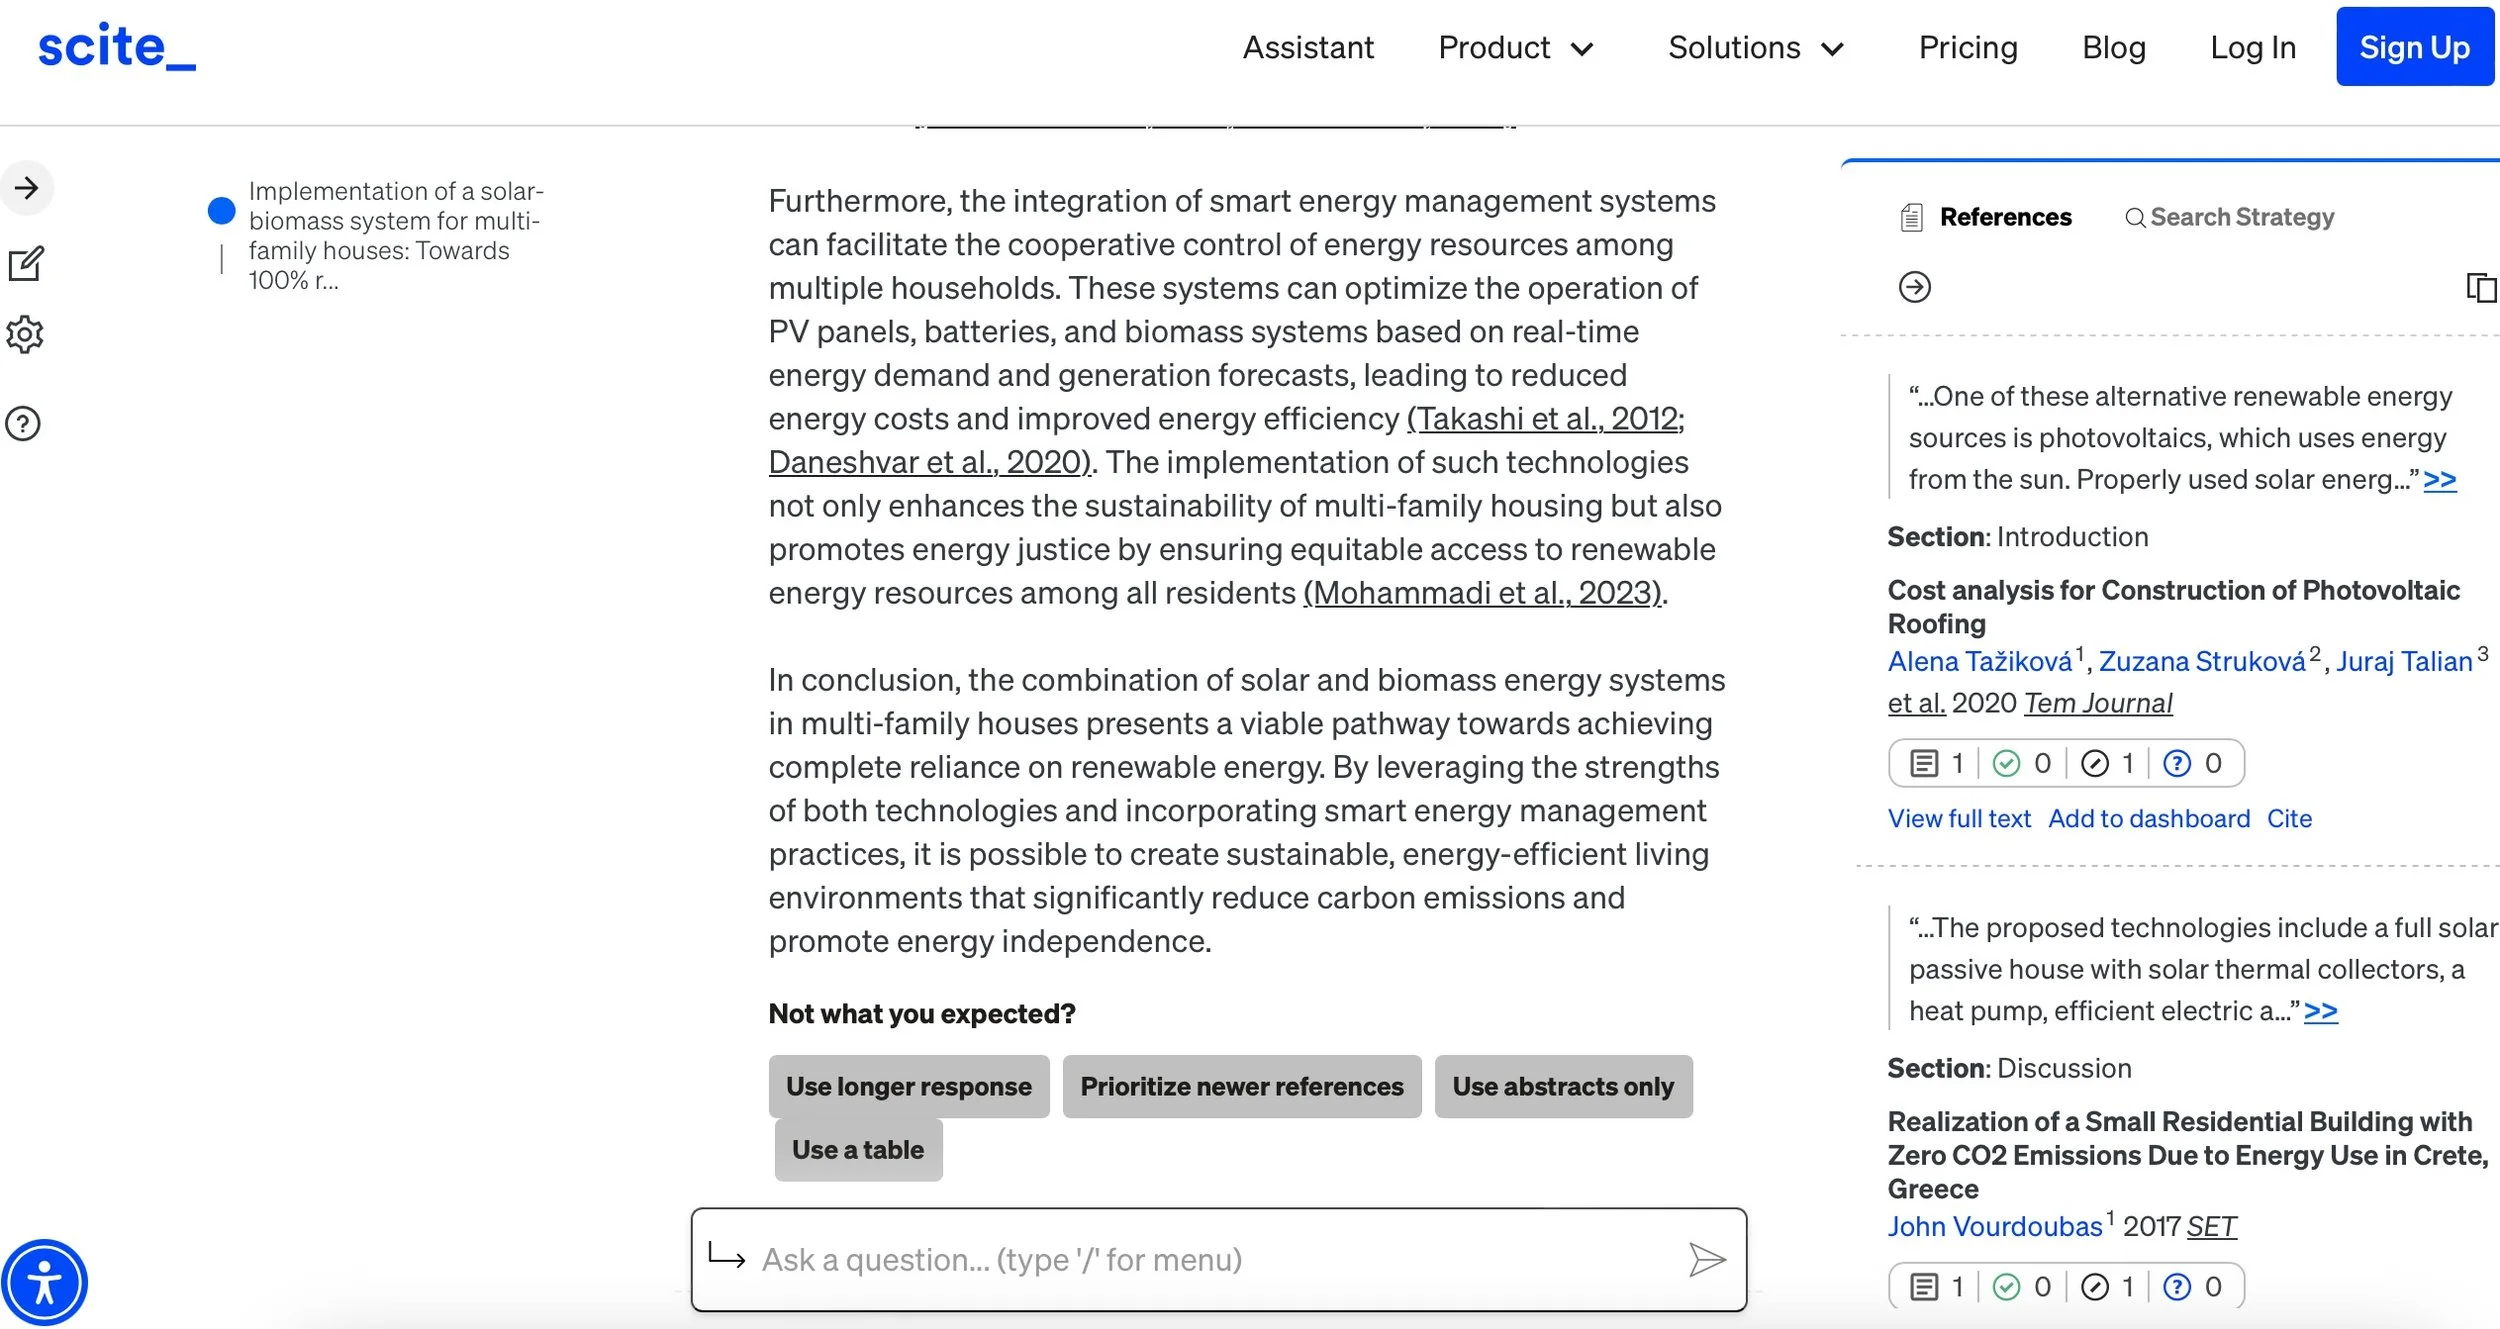
Next up was Scite. This platform also provided generative text summaries based on articles, but what I found particularly useful was how it shows you the search strategy it used, allowing you to refine your results. It also provides a list of consulted publications and references, making it easy to track the sources. One interesting yet increasingly common feature is the ability to have a natural language conversation with the results, helping you dive deeper into the content or explore related topics.
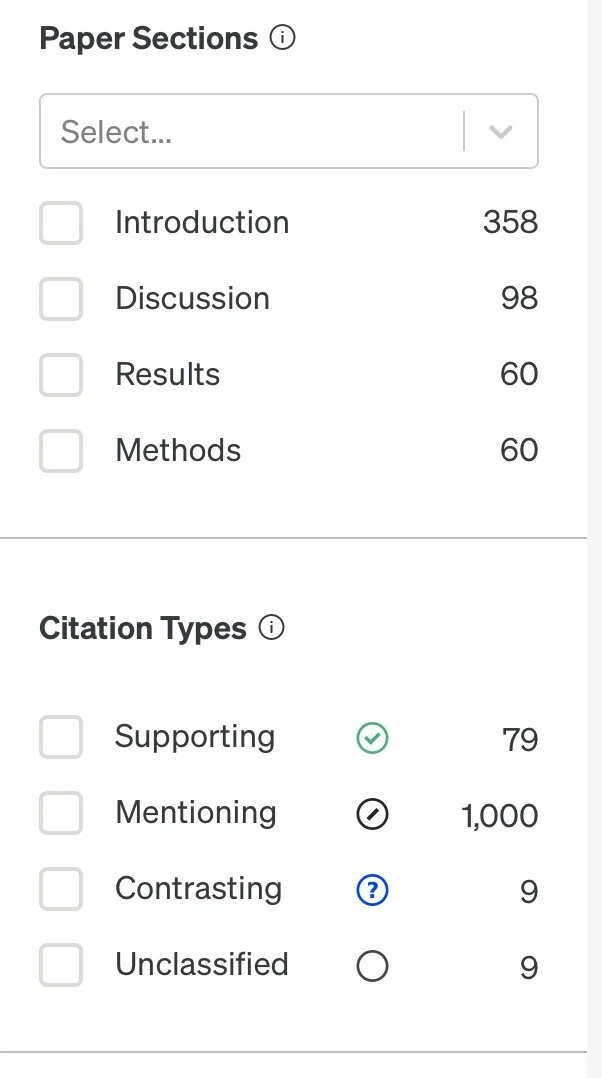
What really sets Scite apart is its ability to indicate whether a citation supports or opposes the material in the article, and even which part of the paper is being cited (like the introduction, methods, or results). This adds a unique layer to the research process by giving you a clearer picture of how a paper is being used—whether it's backing up claims or challenging them. It helps you quickly gauge the impact and relevance of the research in a more meaningful way.


The last one I showed was SciSpace.
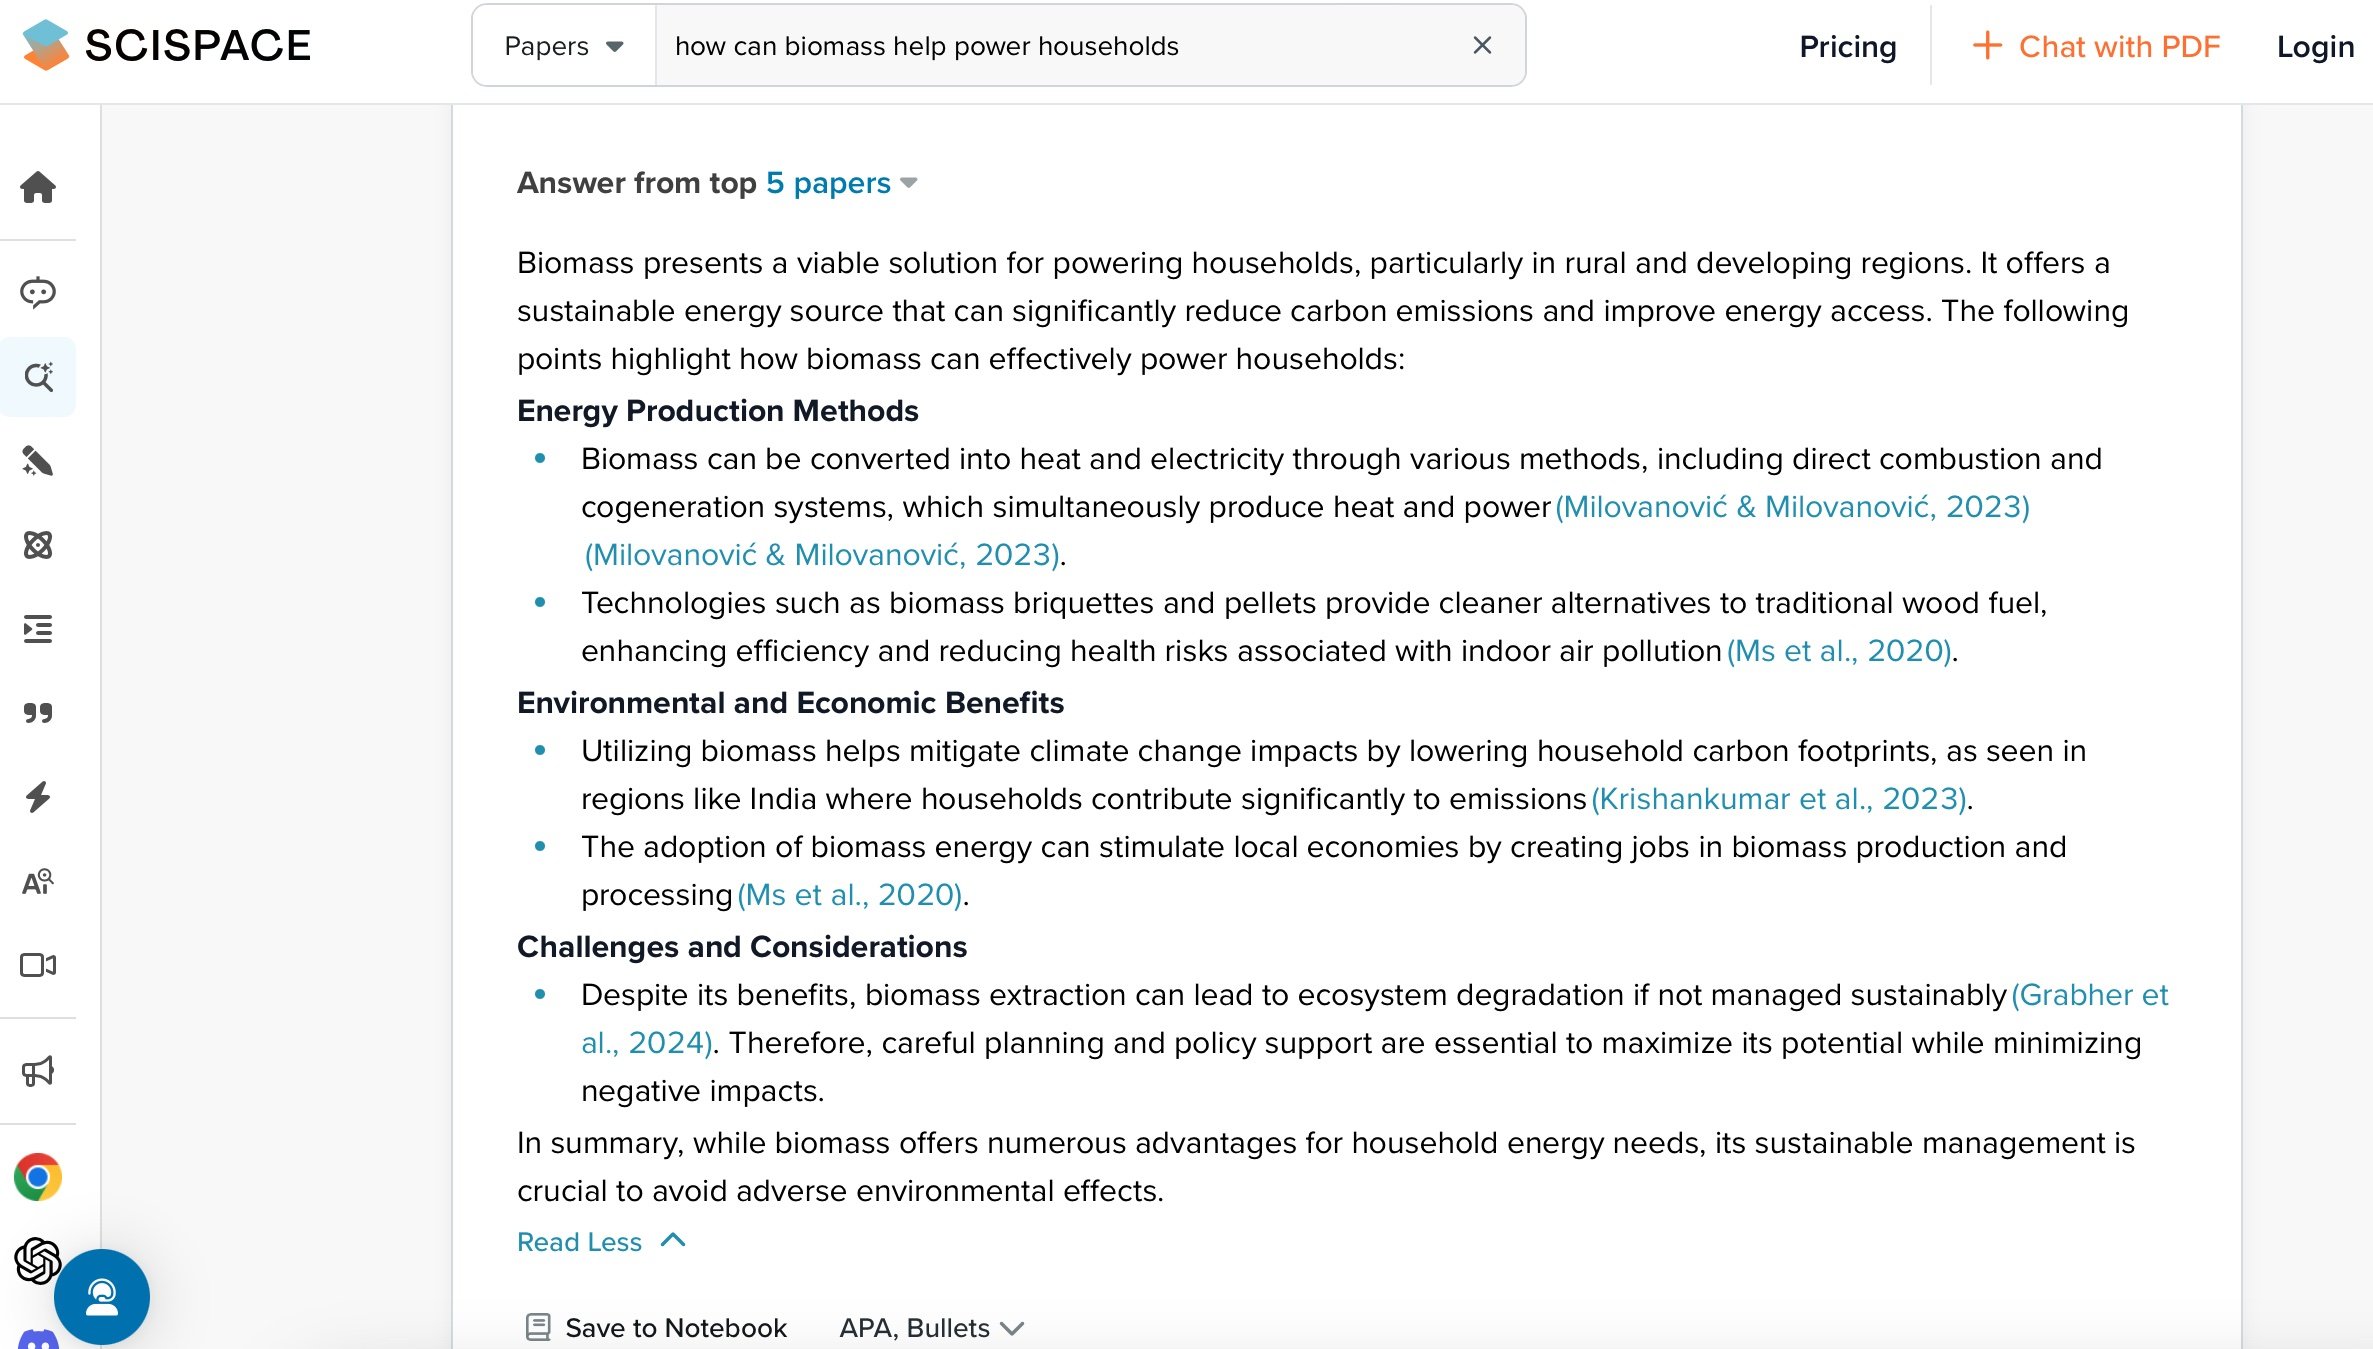
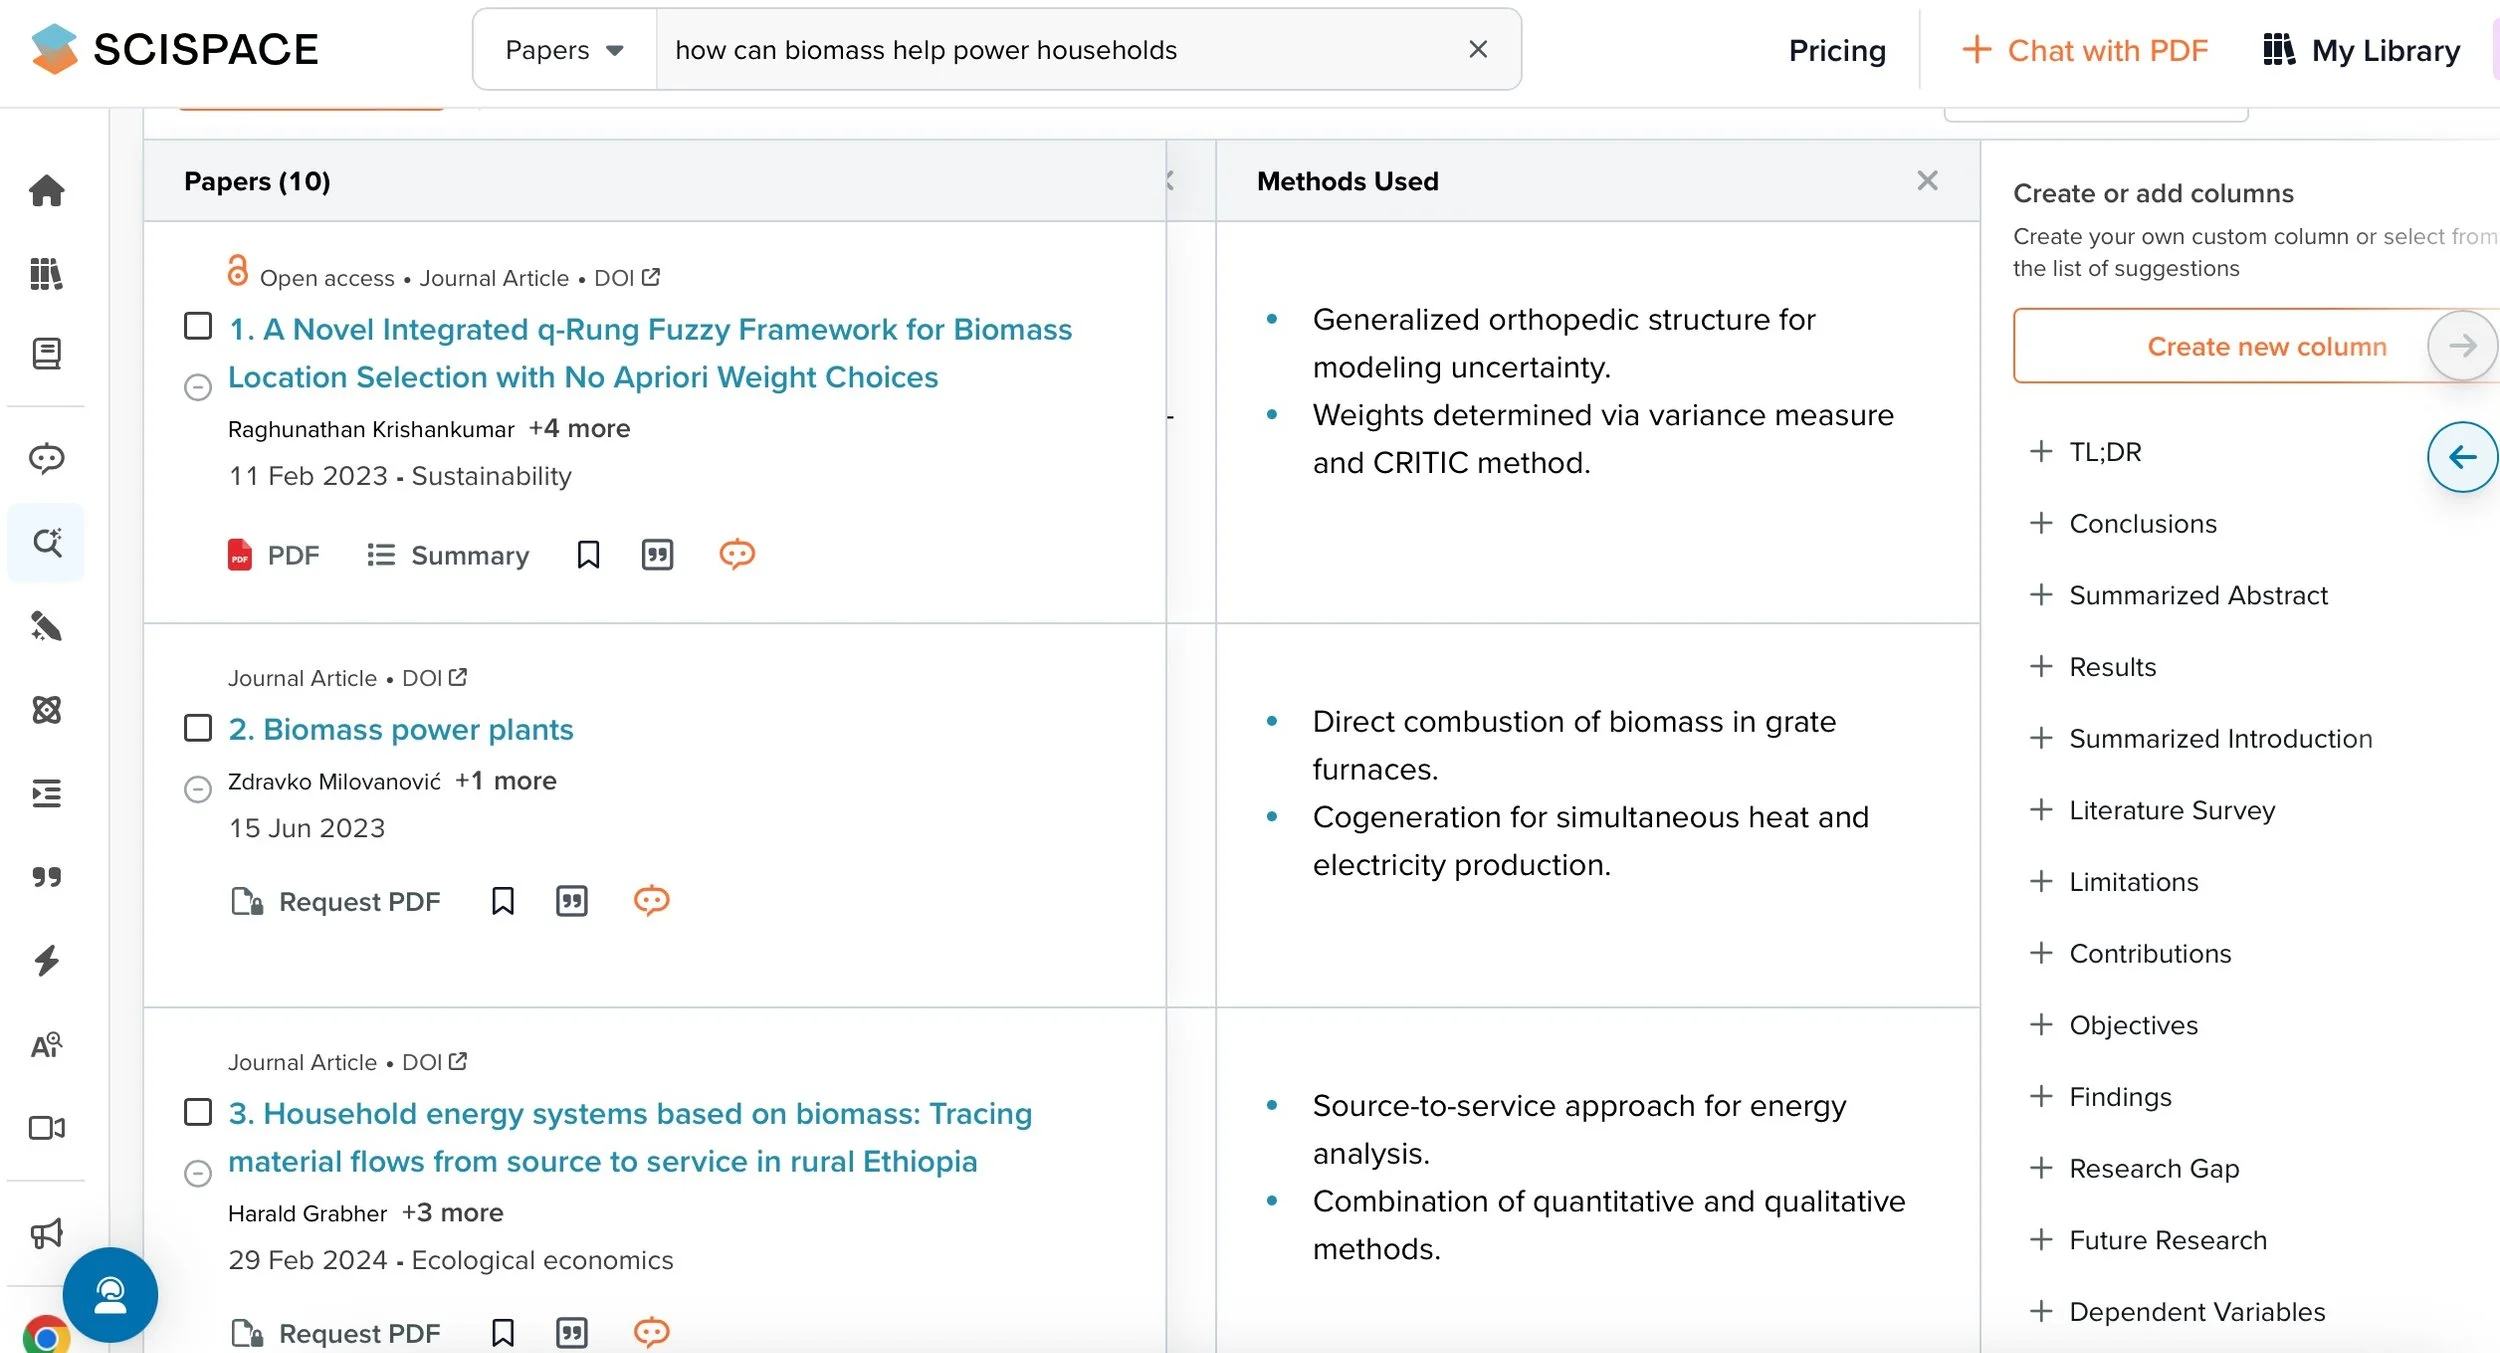
SciSpace invites you to start by asking a question, and then it gathers key papers, providing links, citations, and a high-level summary. What truly sets it apart, though, is its powerful table and column extraction feature. You can pull together a large set of papers on a topic and quickly extract crucial information into a spreadsheet—things like insights, methods, results, research gaps, and variables. This feature saves a huge amount of time, especially when you need to compare specific data points across many papers. The ability to easily organize and extract key details, like results or variables, into a clear, side-by-side format makes SciSpace incredibly valuable for streamlining the research process.
Of course, for the more advanced features and larger scale, there is a paid version—but if you’re writing a dissertation or tackling a big research project, it’s probably worth the investment.
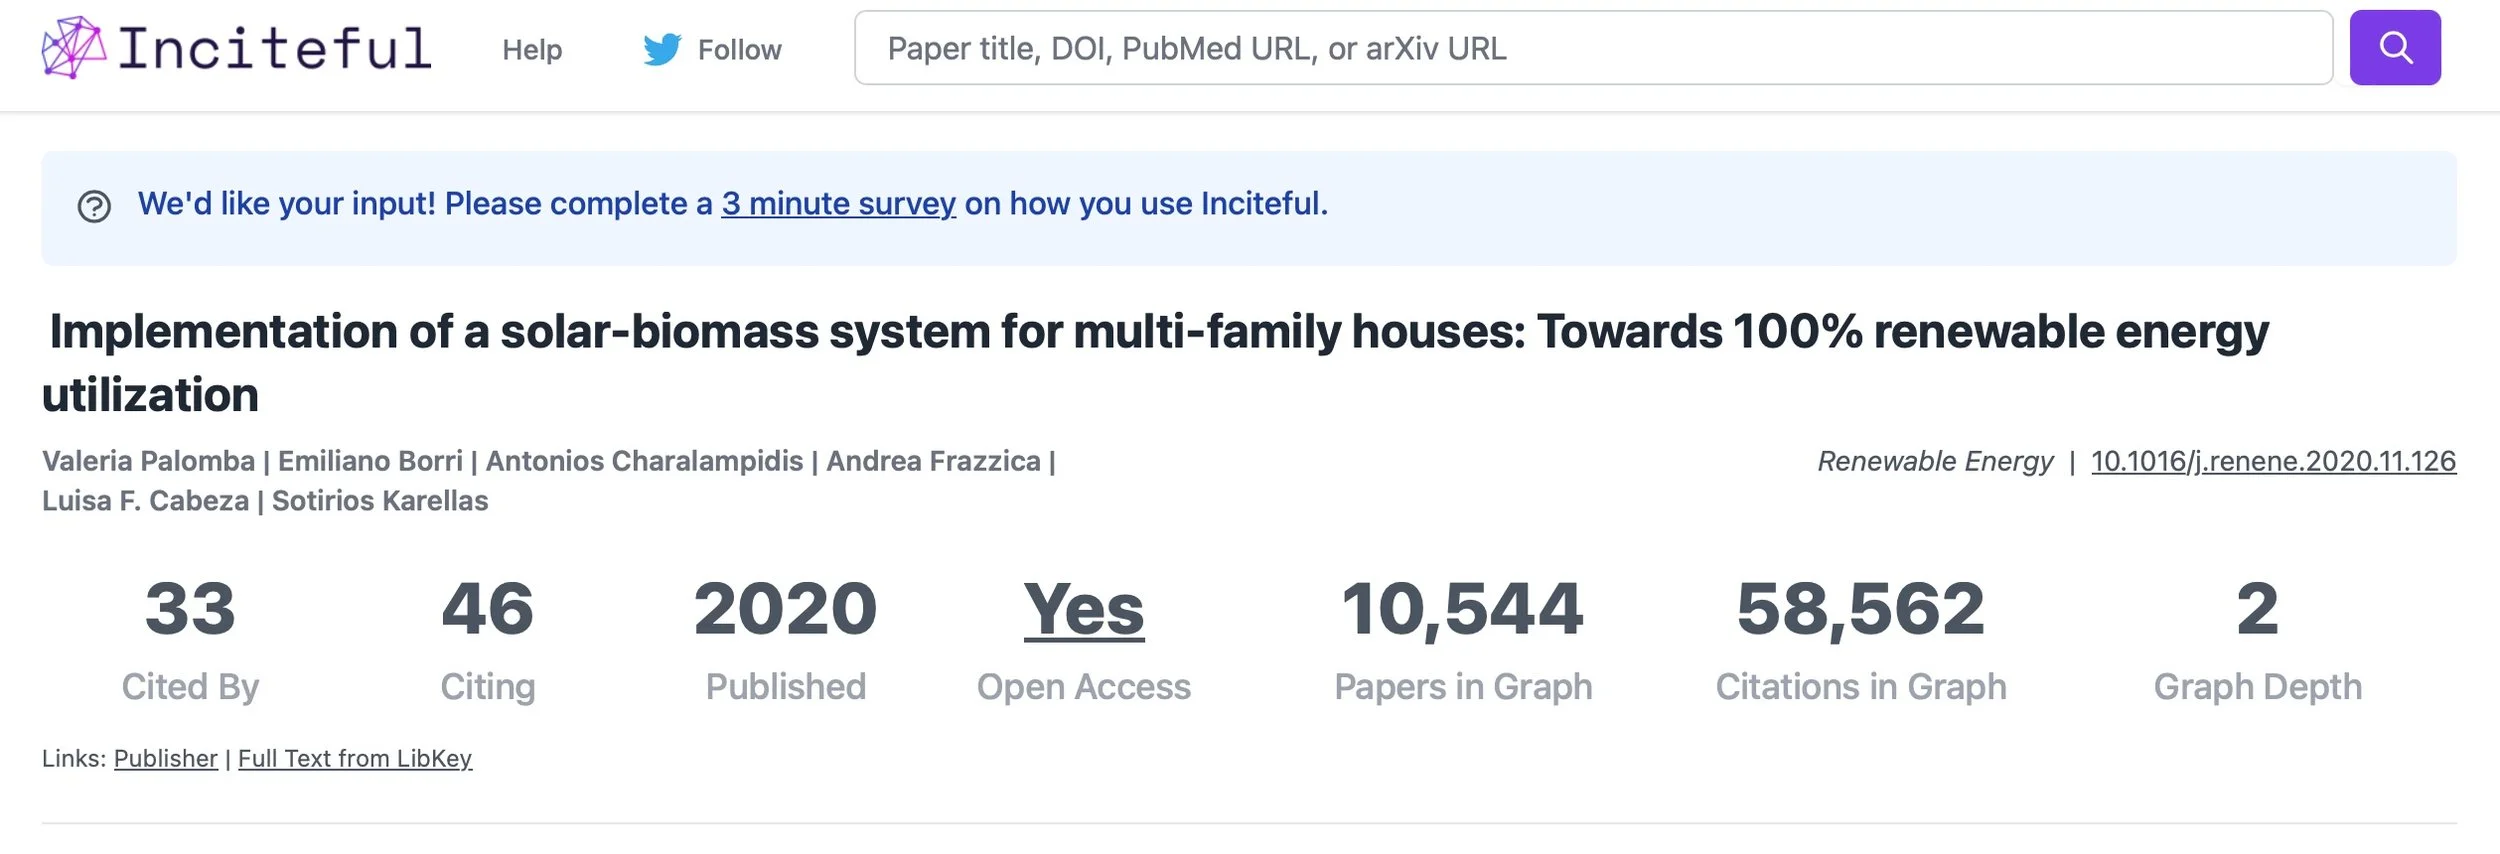
But wait… there’s more! During the session my colleague (and Director of our Evidence Synthesis Program) Sarah Young shared a tool that she uses often: inciteful
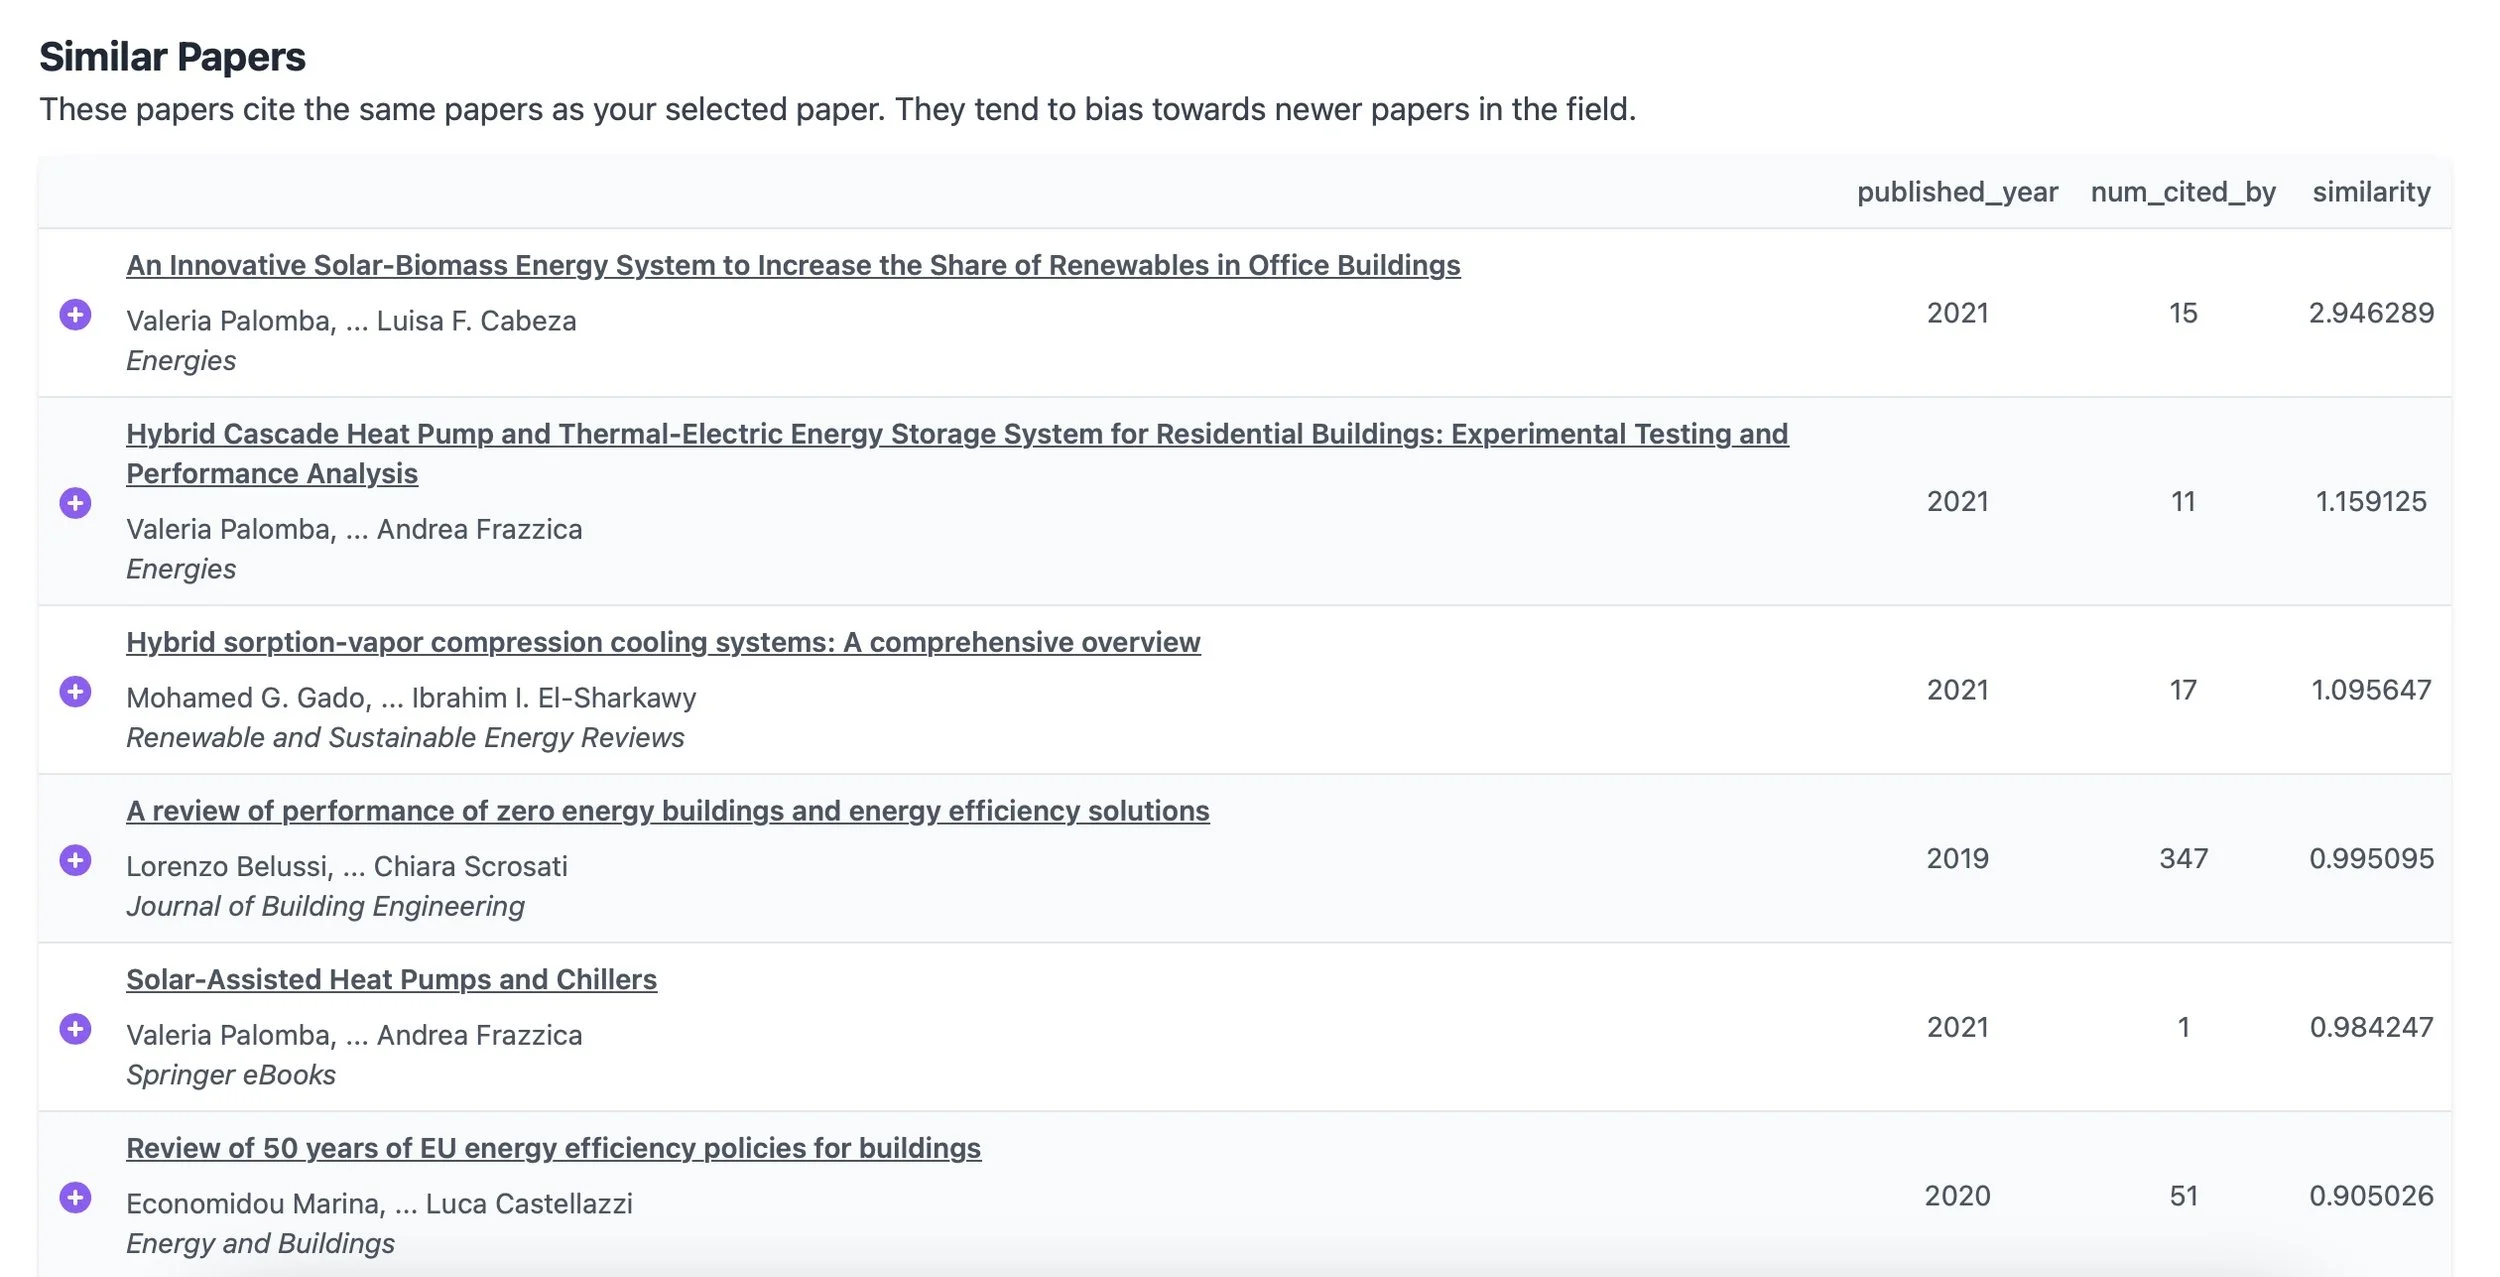
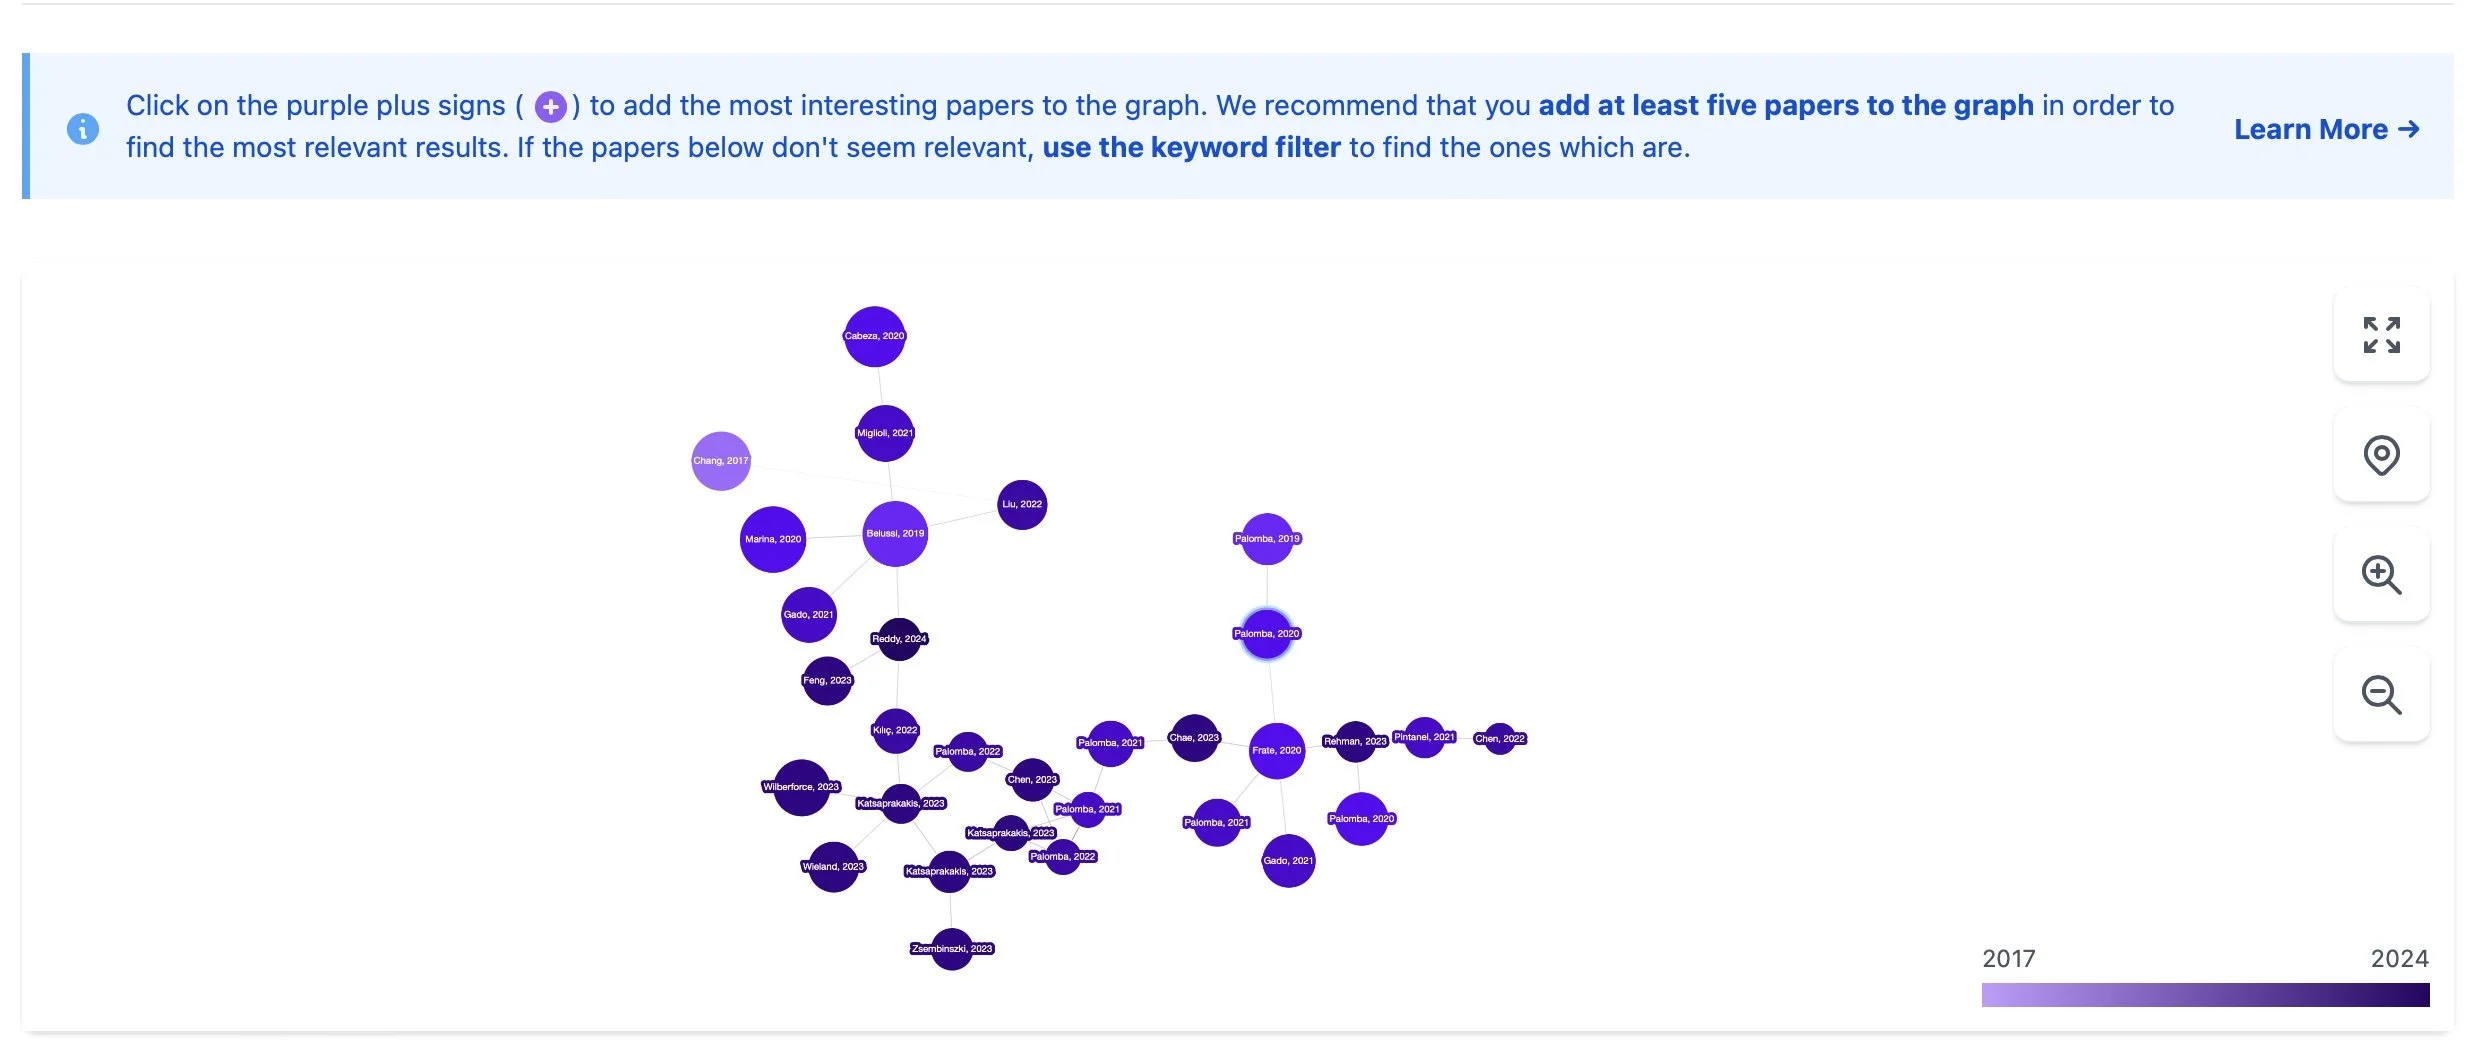
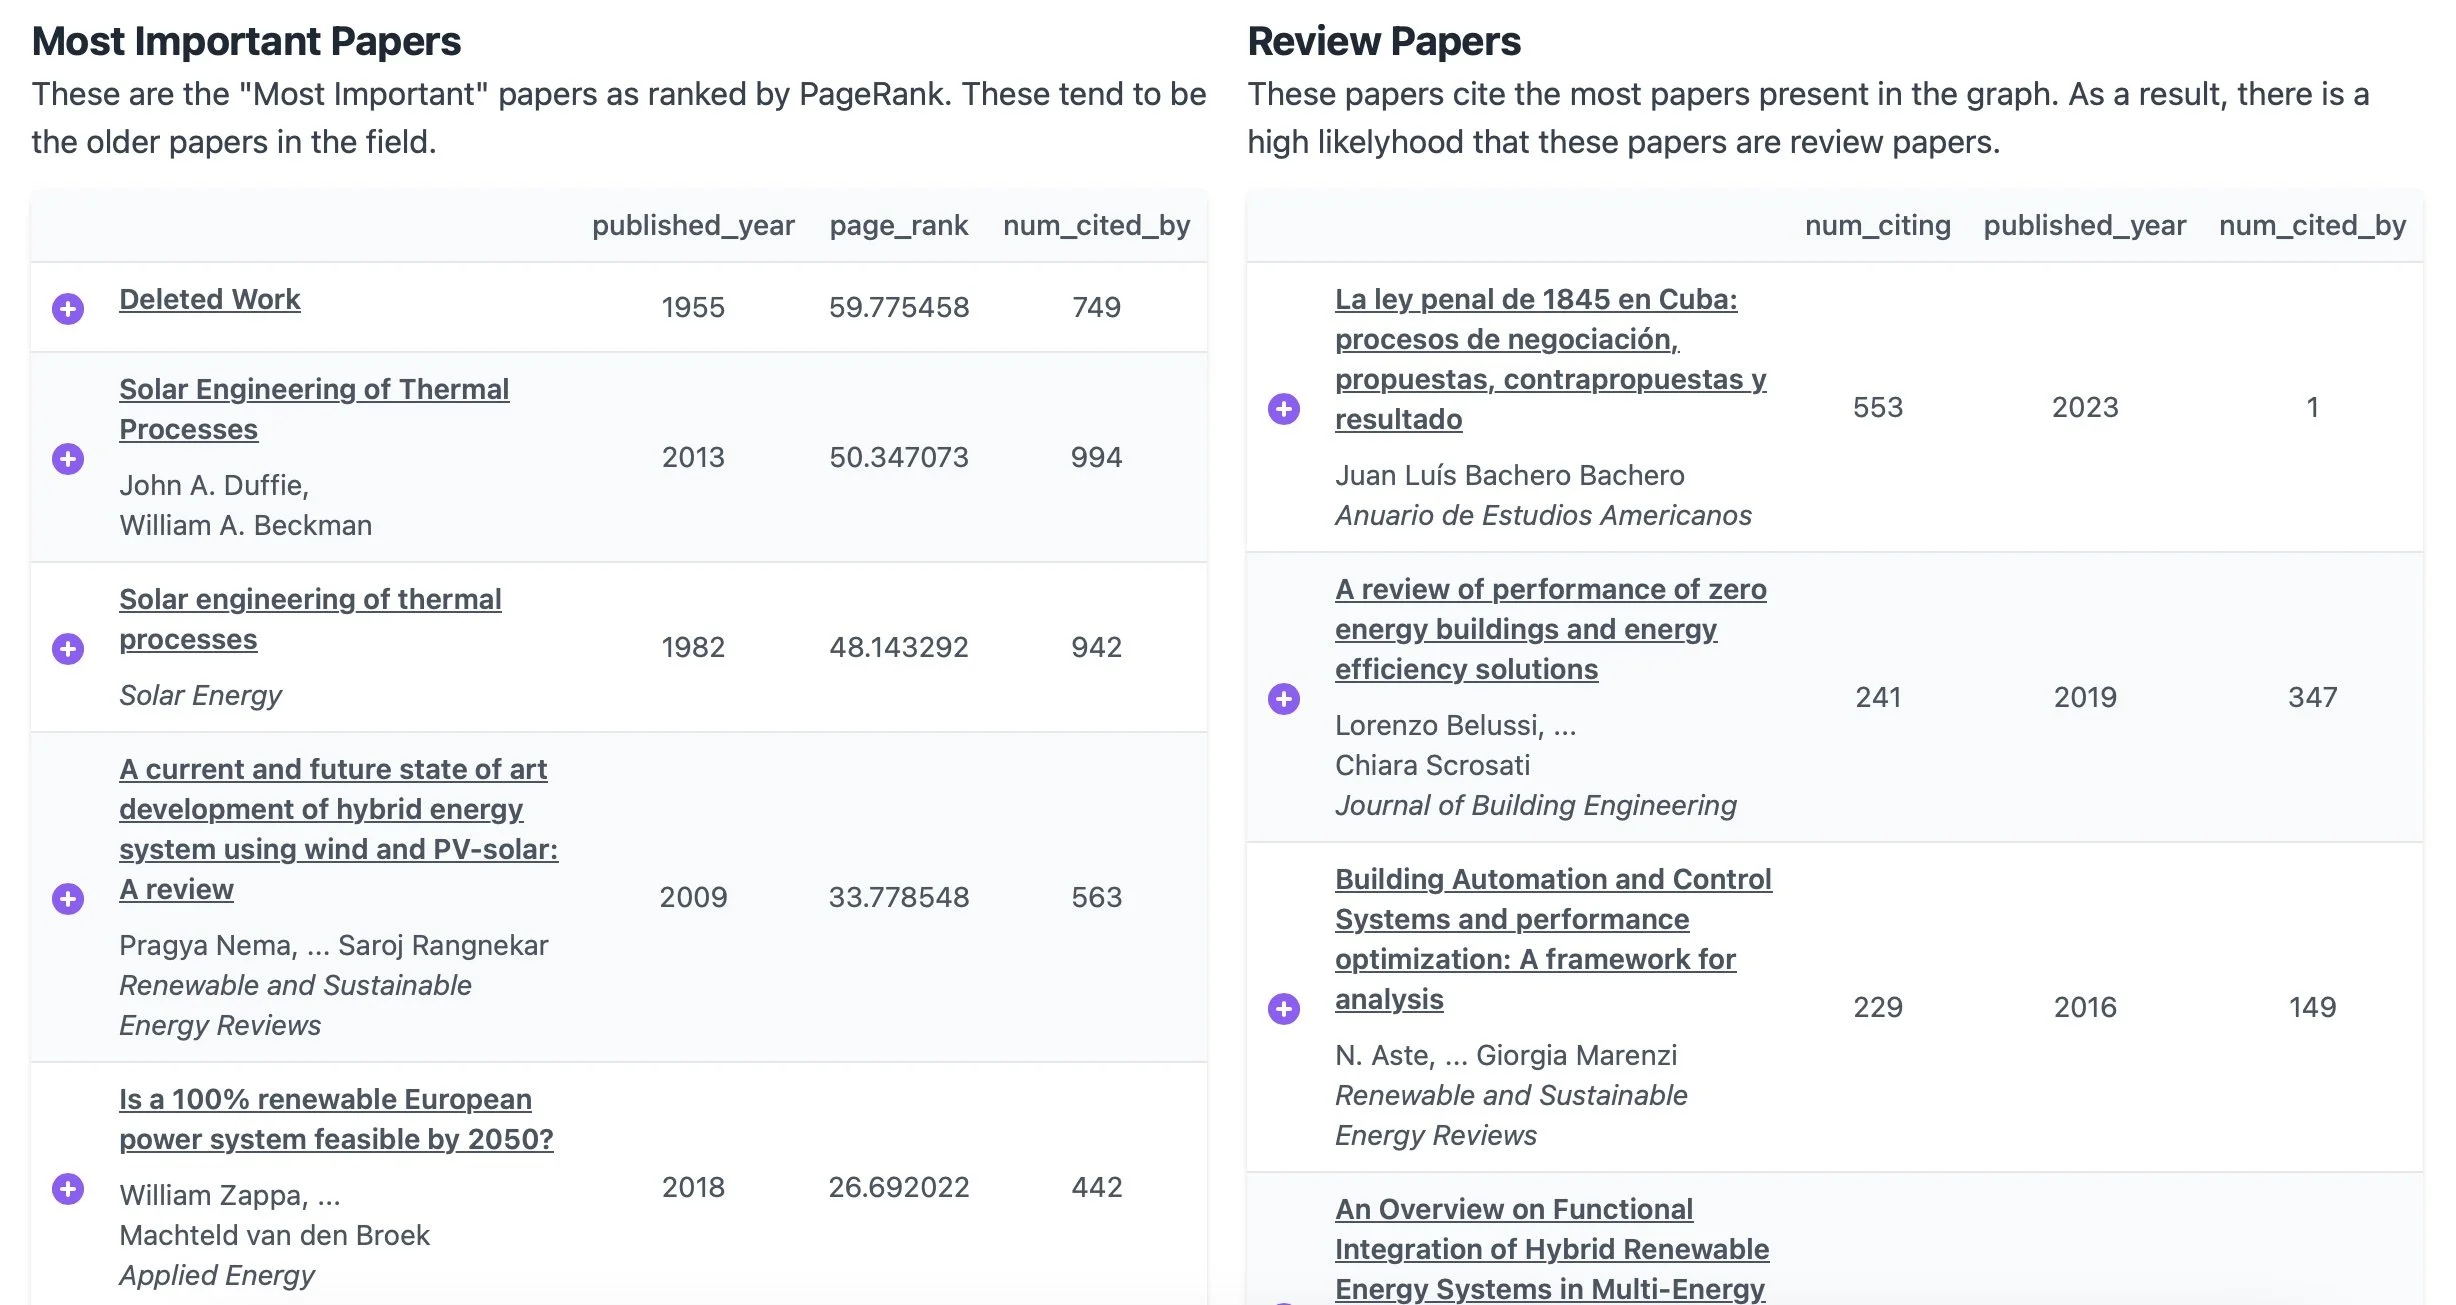
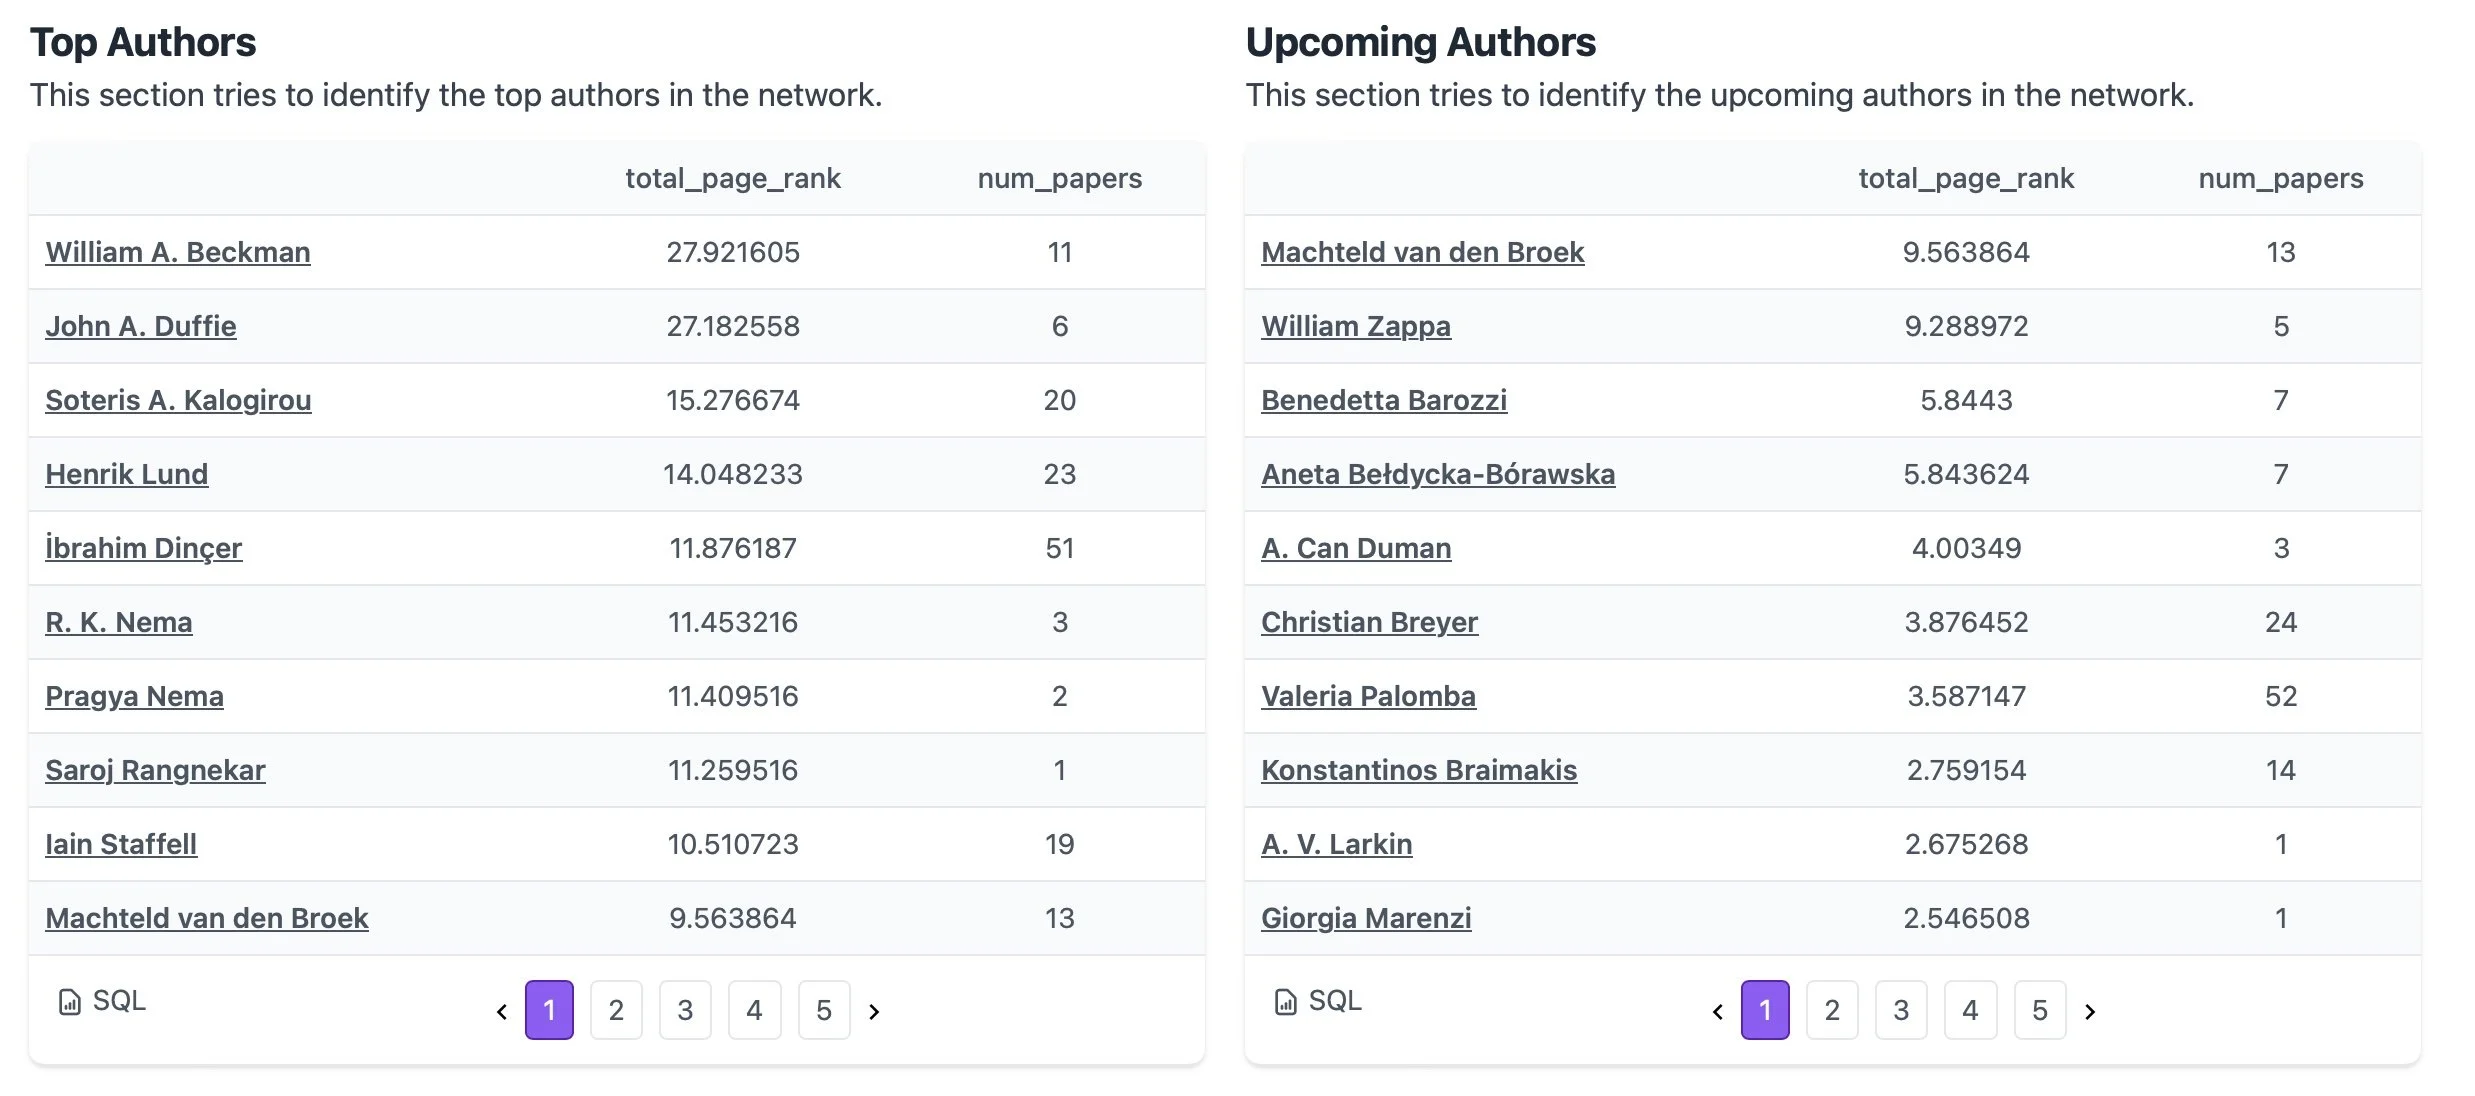
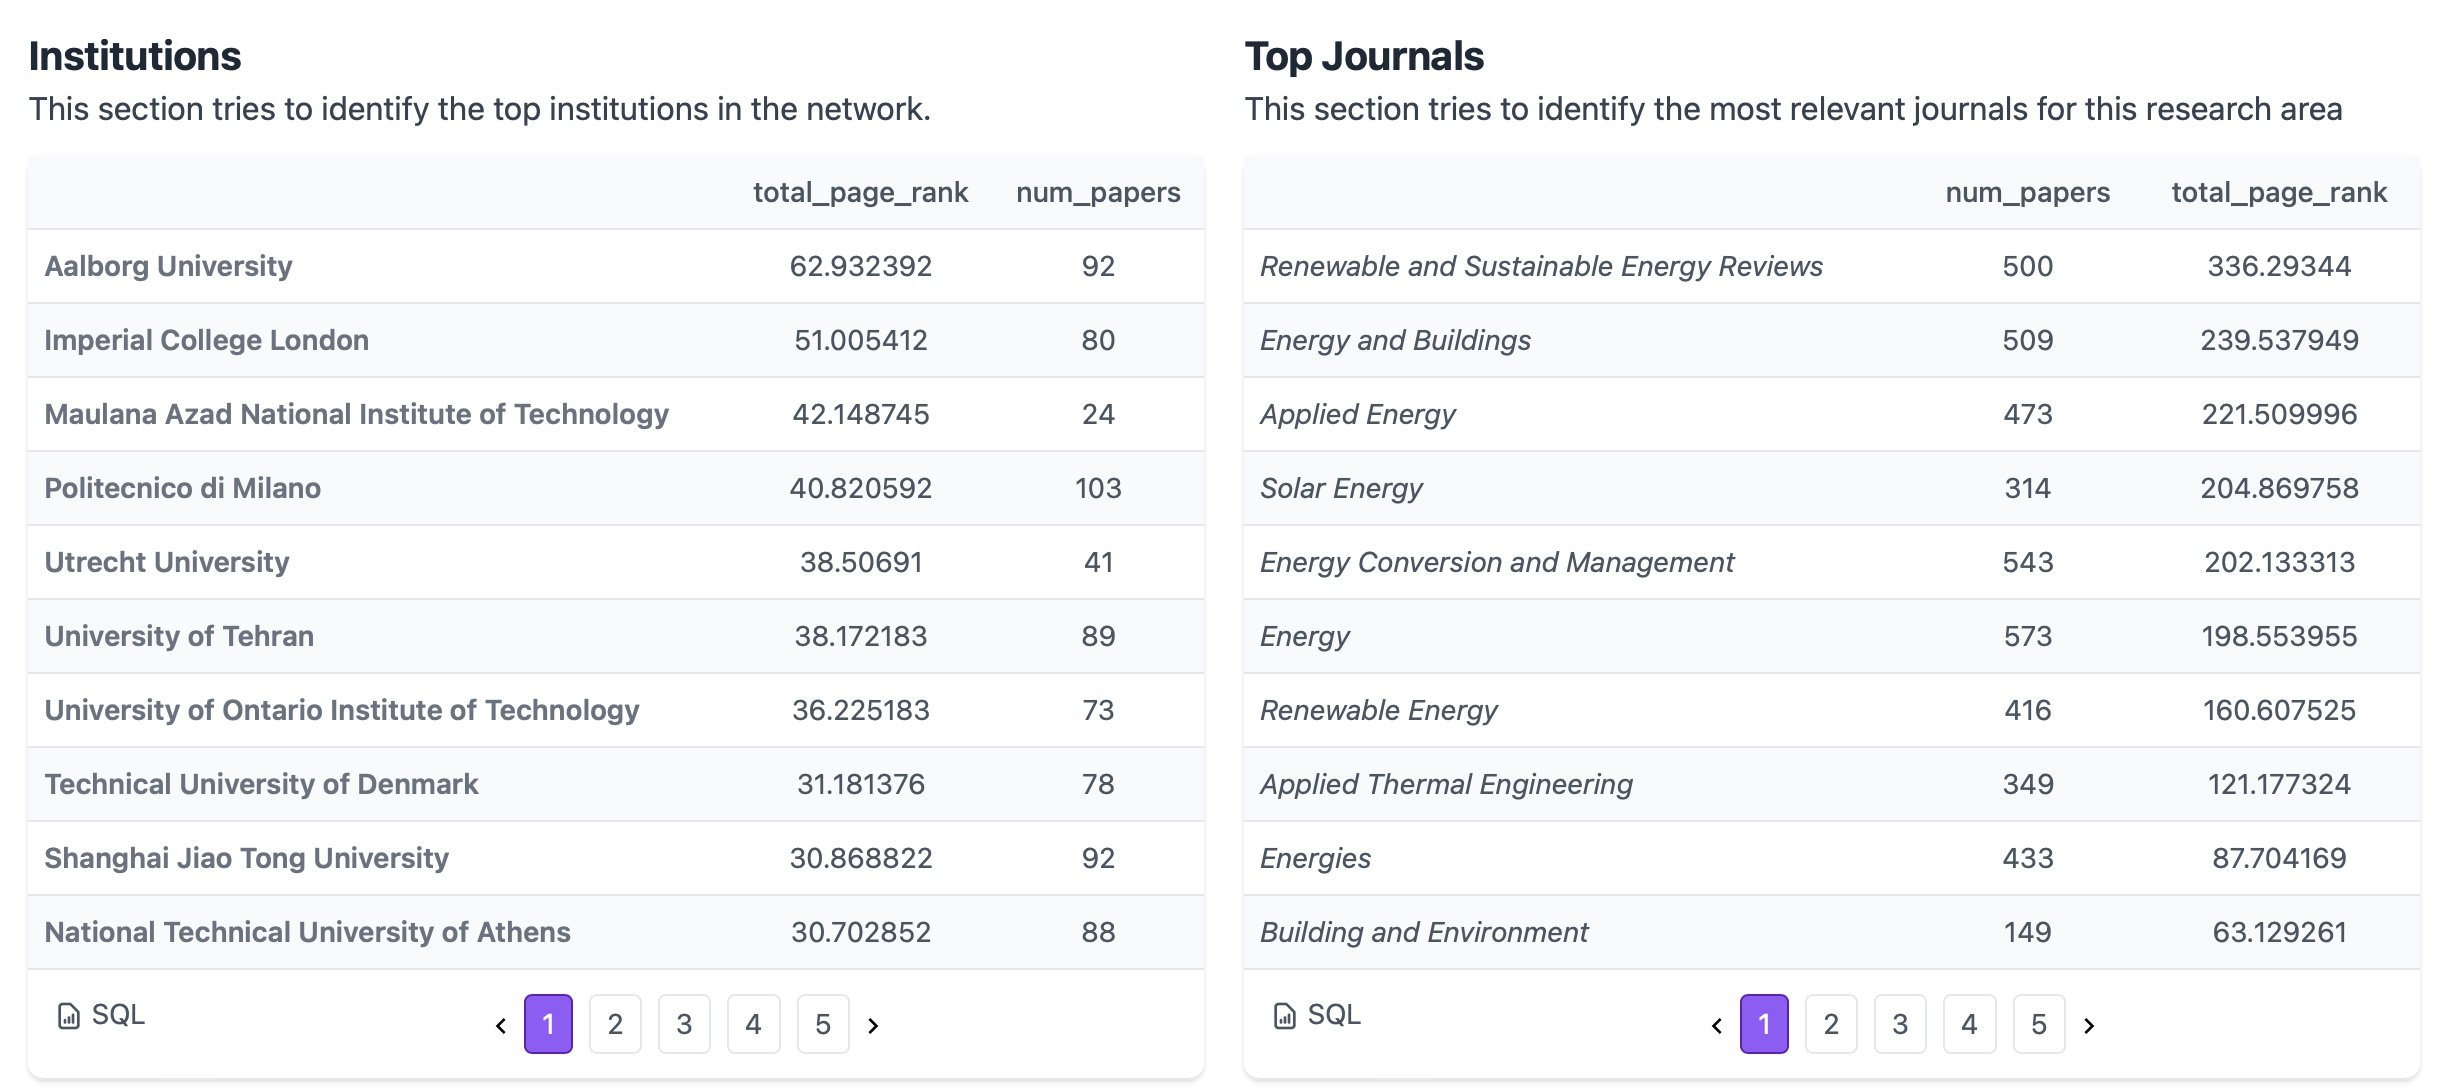
I experimented with it a bit afterward and found it offers some powerful and unique capabilities. You start by entering a paper, and it quickly provides an overview of its citations and cited by data, open access status, and related papers. It also organizes this information into a network graph. One intriguing feature is that it generates lists based on the paper and its network, including Most Important Papers, Review Papers, Top Authors, Upcoming Authors, Key Institutions, Top Journals, and even the most recent and most important recent papers. If you're diving into a topic, this platform really enhances your ability to explore the literature and identify key contributors, trends, and emerging research.

Recap
Here's a consolidated list of some of the capabilities and features across all the platforms:
Visual Citation Mapping: Creating network maps that connect related papers based on citations and even beyond direct citations, revealing broader relationships in research.
Dynamic Updates: Real-time updates to citation maps as new papers are published, helping researchers stay current with evolving literature.
Horizontal Exploration: Innovative Trello-like or panel-based interfaces that move away from traditional vertical search results, allowing for a more visual and intuitive navigation experience.
Semantic and Contextual Search: Searching by meaning rather than just exact keywords, allowing researchers to find relevant content more effectively.
Advanced Data Extraction: Extracting key information from multiple papers into structured tables or columns, making it easy to compare insights, methods, results, research gaps, and variables.
Citation Analysis and Context: Evaluating citations not just by their existence but by their purpose—showing whether citations support or challenge a paper’s claims and identifying which part of the paper is being cited (introduction, methods, results, etc.)
Collaborative Tools: Enabling teams to share boards or maps, annotate findings, and work together on organizing and exploring research.
Personalized Recommendations: AI-based suggestions tailored to the researcher’s interests, providing relevant papers based on the user's research behavior and context.
Summary Generation: Automatically creating high-level text summaries of key papers based on specific topics or questions, which adapts based on chosen filters like dates, countries, or fields of study.
Lists of Key Insights: Generating curated lists of important papers, review articles, emerging authors, key institutions, and top journals, helping researchers identify influential contributions and trends.
Citation Categorization: Distinguishing between supporting, contrasting, and neutral citations, offering a nuanced view of the academic conversation surrounding a paper.
AI Ethical Impact Assessments
I also shared with the group UNESCO’s Ethical Impact Assessment: A Tool of the Recommendation on the Ethics of Artificial Intelligence and the great work that Laurie Bridges is leading in adapting that for libraries.
Closing Thoughts
As I reflected on this wave of AI tools, I was reminded of the early days of radio and software development. In those eras, before regulations and standardized platforms like Windows or established operating systems, there was a sense of wild experimentation. Anyone could set up a radio station and broadcast unique shows, much like early software developers could experiment freely before more rigid frameworks and standard operation systems emerged.
Tim Wu captures this perfectly in The Master Switch, where he explores how industries like radio started with an open, creative phase before becoming centralized and regulated. Similarly, The New Media Reader offers a glimpse into the early days of software and digital media, showcasing a period where creativity and innovation flourished before the dominance of standardized systems.
We’re in a similar phase with AI tools right now—there are no dominant platforms (besides Chat GPT?) or strict rules yet, leading to a proliferation of niche products. Just like with the early eras of radio and software, this freedom is fostering innovation, but it’s also likely that we’ll soon see consolidation. That makes this current moment a special one—an era of discovery and experimentation that won’t last forever.
