Mapping SDGs across the education and research ecosystems
Following up on my recent post about the Sustainability Studio, I also want to share how we utilized data from Symplectic Elements to support CMU’s Sustainability Initiative. By mapping each of the UN's Sustainable Development Goals (SDGs) across the university’s teaching and research activities, we addressed a crucial challenge: identifying who is working on what.
This mapping initiative (led by our RIMS team) is particularly useful from a convener's perspective. With our data, we can look across the ecosystem to identify individuals working on similar topics who may not yet be aware of each other. This mapping also benefits students seeking courses or advisors based on specific themes and researchers looking for potential partnerships in particular areas. By mapping the SDGs to our campus community, we have opened doors to new conversations and collaborations.
Here are a few screenshots from our Tableau dashboard:
This is an overview of research at CMU across the SDGs based on our available data. Health (3) , Energy (7) and Quality Education (4) are some of our largest areas.
Let’s look at one of our smaller ones: goal 6 (clean water and sanitation)
We can get the names of people working in that area and see their department. Here is a quick example.
Aside from a university-wide view, we can also narrow and look at research or other outputs by a particular college or individual department. It’s interesting to see the variety.
Electrical and Computer Engineering
Tepper School of Business
College of Fine Arts
We can also look an individual. For example, here is Corey Harper. I can see the different SDGs that his work stretches across.
SDGs & Teaching
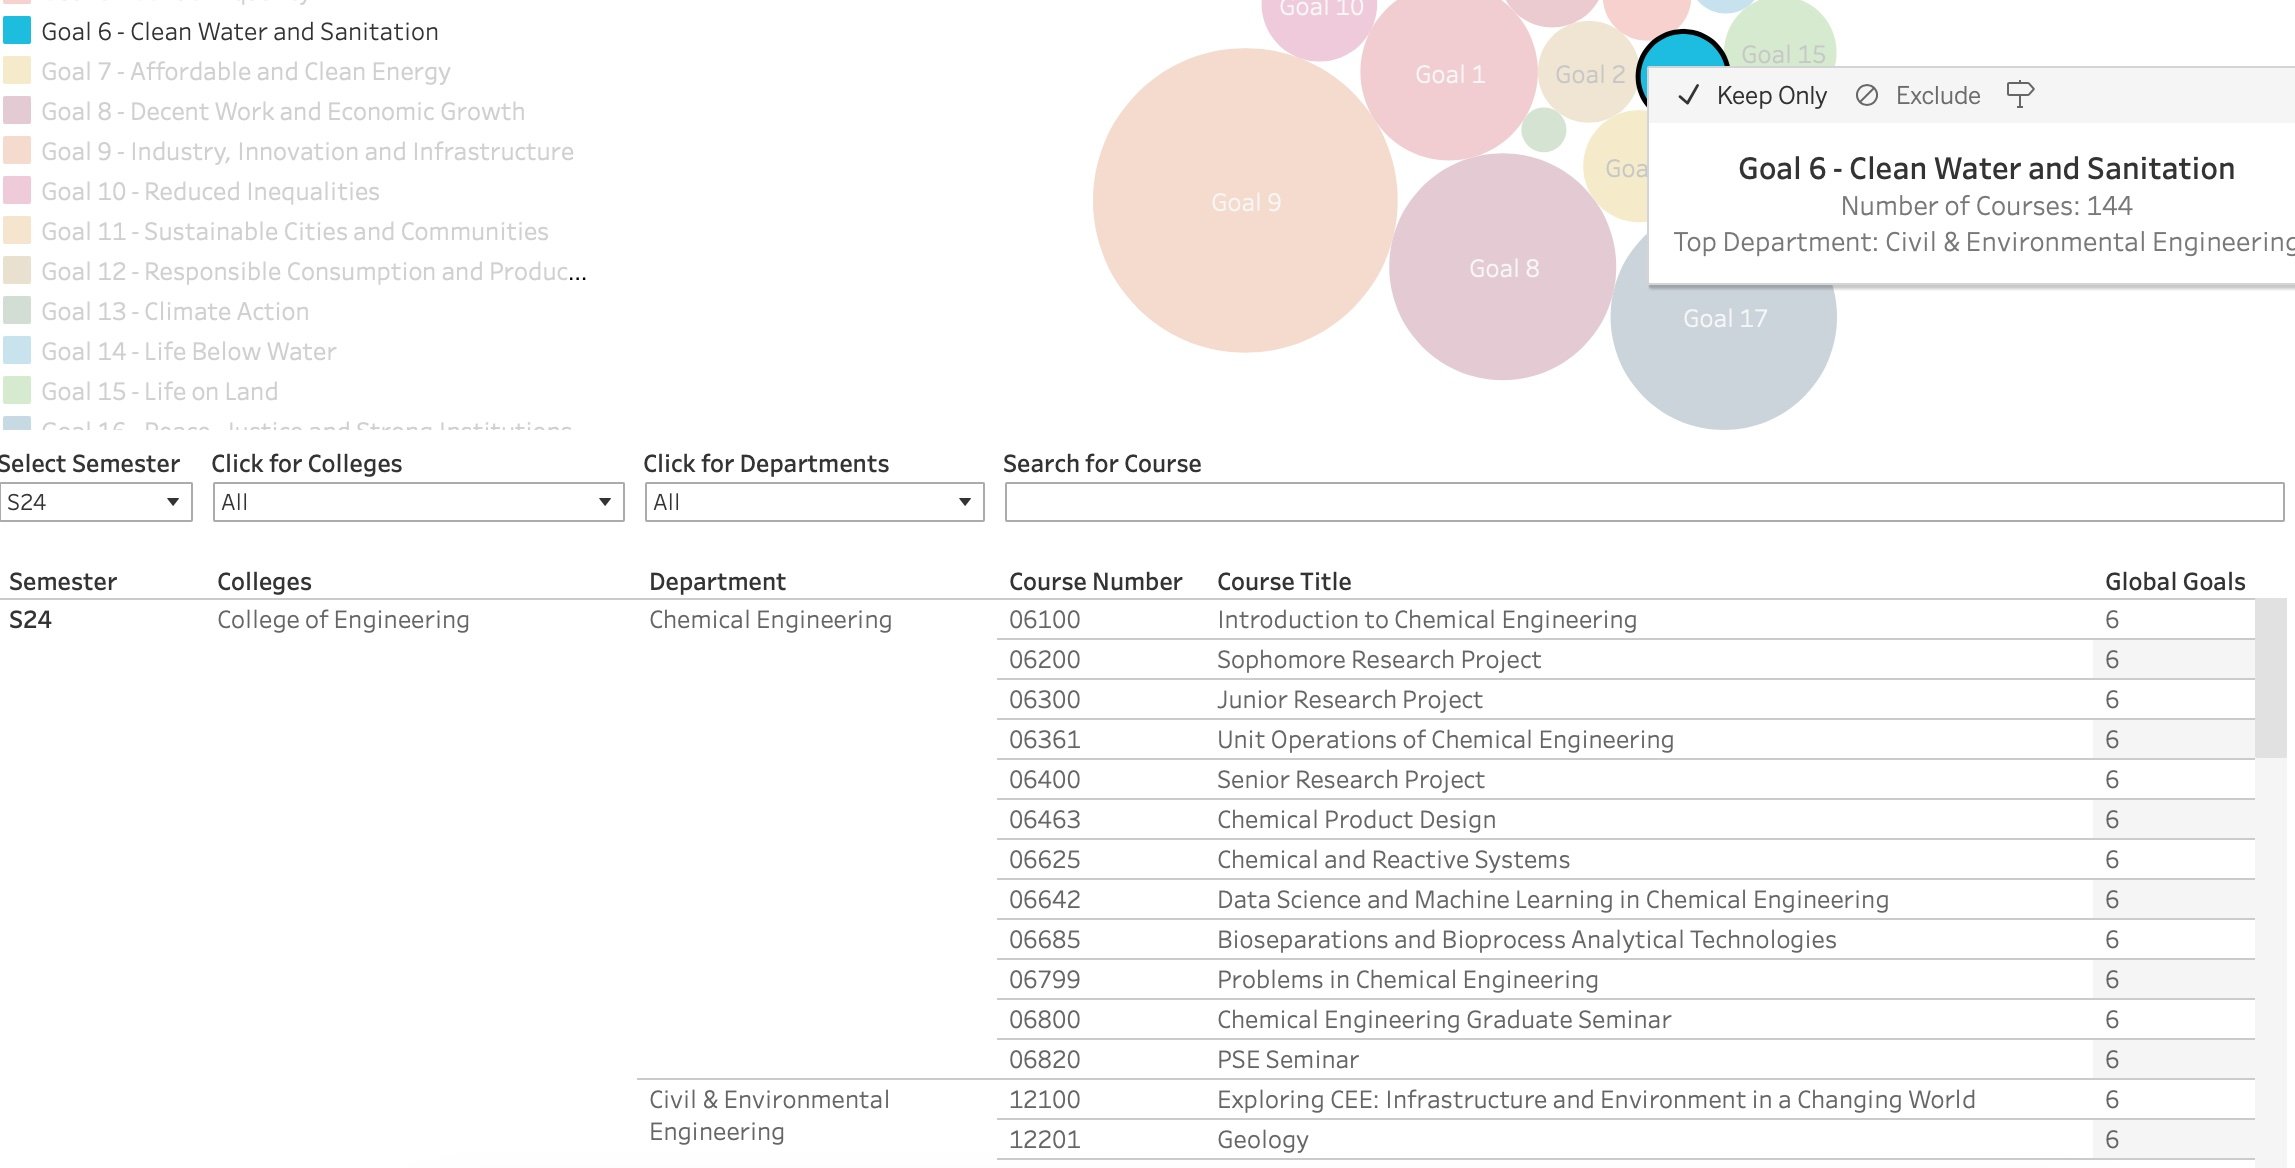
We can also explore courses too and see how they align with the different SDGs. This is the overview.
We can select a goal and drill down. Let’s stick with clean water — this is one I’m personally very interested in. We can explore this SDG by college and department — and ultimately land on a list of courses
The value of mapping SDGs
This tool effectively integrates our RIMS program with the Sustainability Initiative, allowing everyone to quickly identify who is working in various areas. It enables colleges or departments to see how their activities align with the SDG landscape, facilitating the identification of individuals for potential projects, panels, partnerships, grants, lectures, or other opportunities. The SDG framework serves as a contextual interface for exploring teaching and research activities, ultimately driving a more interconnected and engaged academic community.
Here is a video that provide more details and outlines how the data was assembled:
Shout-out to Jason Glenn and our RIMS Program the terrific work they do: my earlier post about our unique approach to managing Elements at CMU.


